|
|
1.IntroductionFrom rapid advances in autonomous vehicle technology to more ubiquitous driver assistance features in modern automobiles, the vehicle of the future is increasingly relying on advances in computer vision for greater safety and convenience. At the same time, providers of transportation infrastructure and services are expanding their reliance on computer vision to improve safety and efficiency in transportation. Computer vision is thus helping to solve critical problems at both ends of the transportation spectrum—at the consumer level as well as at the level of the infrastructure provider. The ever-increasing demand on a limited transportation infrastructure leads to traffic congestion, freight transportation delays, and accidents, with vast negative economic consequences. Advances in computer vision are playing a crucial role in solving these problems in ever more effective ways—in traffic monitoring and control, in incident detection and management, in road use charging, in road condition monitoring, and in many more. Attractiveness of computer vision for these uses primarily stems from the cost-efficiency of these technologies as well as the wide range of applications that computer vision can support. Advanced driver assistance systems (ADAS) are being deployed in ever-increasing numbers, but as the in-vehicle compute power increases and as vehicle-to-infrastructure communication becomes more robust, these systems will begin to change their role from one of providing assistance to one of facilitating decision-making as it relates to safety. This article provides a comprehensive survey of methods and systems that use computer vision technology to address transportation problems in three key problem domains: safety, efficiency, and security and law enforcement. We have chosen this taxonomy and these key areas based on our own survey of the literature and from conversations with transportation agencies and authorities. In each of the problem domains, the main approaches are first introduced at a cursory level, and a few representative techniques are then presented in greater detail along with selected results demonstrating their performance. Where possible, the technology descriptions are interspersed with the authors’ own perspectives on challenges, opportunities, and trends. Table 1 presents the taxonomy by which the survey is organized. Table 1Taxonomy of problem domains, applications, and associated references presented in this survey. The remainder of this paper is organized as follows. In Sec. 2, computer vision technologies applied to safety applications are discussed. Technologies relevant to efficiency improvement in transportation are presented in Sec. 3. Section 4 reviews advances in computer vision technologies in the areas of security and law enforcement applications. Future trends and challenges are summarized in Sec. 5. 2.Safety and Driver AssistanceIntelligent transportation systems (ITS) are being developed in many countries with the aim of improving safety and road traffic efficiency. A key focus of ITS is the technology within the so-called ADAS. Most ADAS utilize some form of sensing the surrounding environment of a vehicle. Computer vision plays a crucial role in sensing the environment, extracting relevant analytics, and acting on the extracted information. In this section, we focus on several of the many within-vehicle applications of video technology and computer vision that offer the potential for significant improvements in roadway safety and driver assistance. 2.1.Lane Departure Warning and Lane Change AssistantResearchers from the Insurance Institute for Highway Safety (IIHS) estimated that if all vehicles had lane departure warning systems, the potential exists to prevent or mitigate as many as 37,000 nonfatal injury crashes, 7,529 fatal crashes, and about 179,000 crashes a year overall.1 It has also been reported that a significant cause of such mishaps is driver distraction, inattention, or drowsiness.2 Currently, the most common approach for preventing unwanted lane departure is to employ roadside rumble strips, which vibrate as a vehicle veers in certain undesirable directions. However, this roadway alert system is present on only a very limited set of highways. One approach to preventing this type of accident is through the use of lane departure warning (LDW) systems.3 LDW systems typically track roadway markings using a video camera mounted near the rear-view mirror or on the dash board of a vehicle so the area in front of the vehicle may be viewed. A warning signal is given to the driver if a vehicle unintentionally approaches a lane marking (i.e., without activating a turn signal). Typical warning signals utilize sound, haptics, such as a steering wheel or seat vibration, or lights and display systems. The prevalence of LDW systems is expected to rapidly increase. Various tax incentives are proposed in the United States for vehicles with LDW systems, and legislation in Europe mandates that new truck models will be fitted with LDW systems from November 2013, and all new vehicles from November 2015. The forums creating standards for LDW systems are the International Organization for Standardization and the Federal Motor Carrier Safety Administration. There are two key areas for standardization to consider: a warning threshold, which determines when a warning is issued, and a speed threshold and road curvature, which are both used to classify the LDW systems. A summary of the standards is given in Tables 2 and 3.4 Table 2Summary of standards for lane departure warning.
Table 3Location of earliest warning threshold.
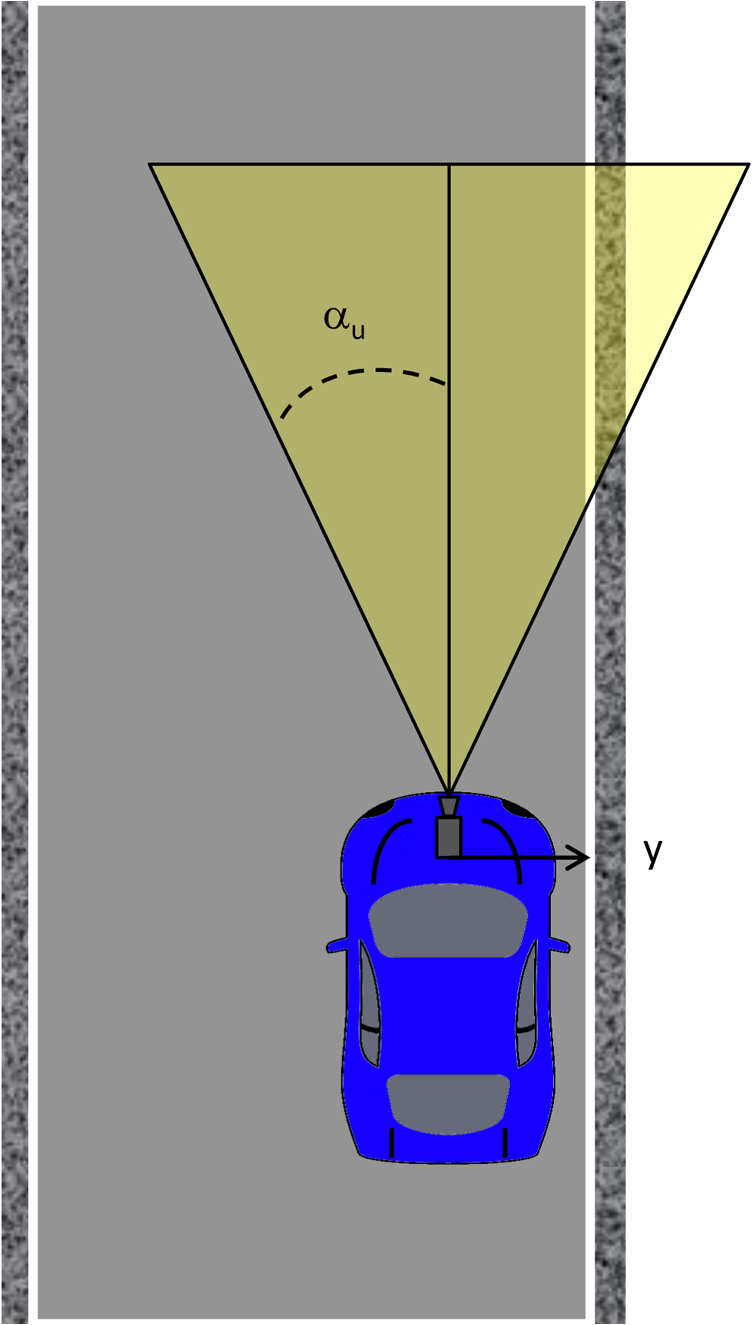
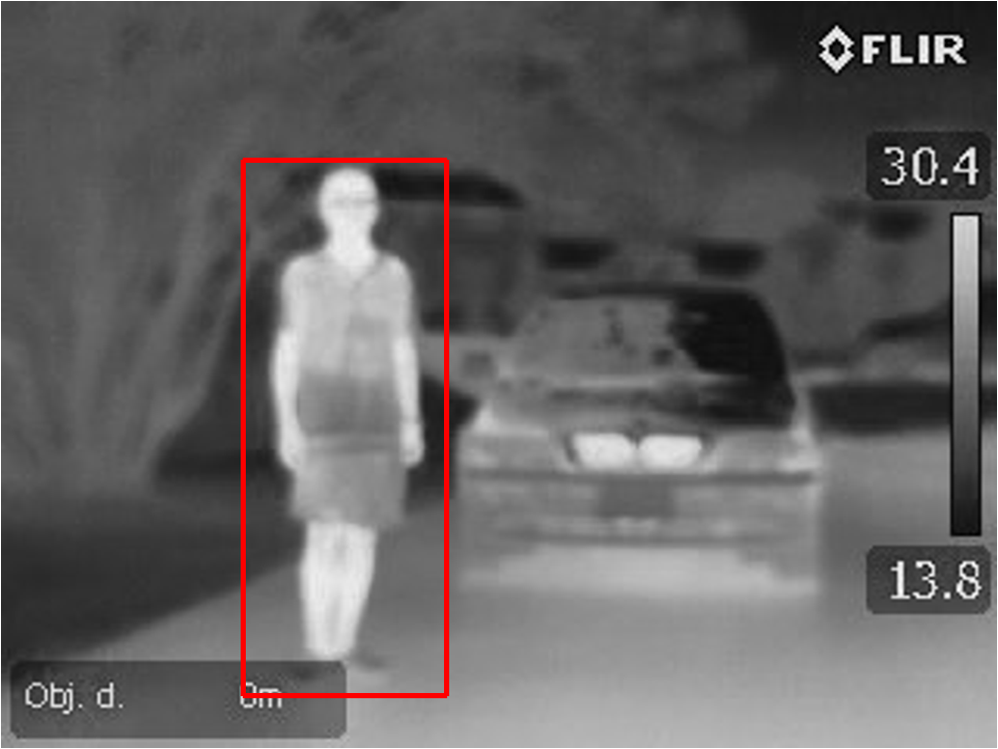
LDW cameras are typically positioned to view a distance of in front of the vehicle with roughly a 50-deg viewing angle. Roadway marking detection algorithms face the daunting task of operating in real time and under multifarious weather conditions to detect and decipher within this limited field of view a wide assortment of markings including broken lines, unbroken lines, double lines, writing in lane (e.g., car pool, arrows), only a center line, only an edge line, Bott’s dots, hatched line, highway entrance and exit markings, white lines, and lines of varying hues of yellow.5 Environmental conditions that further complicate the recognition task include rain and wet asphalt, nighttime lighting conditions, sun on the horizon, shadows, snow, fog, light-colored roadways (e.g., cement), tar seams, unmarked roads, road damage or regions of repair, legacy lines, and nearby vehicles. An LDW system should give as much warning time as possible, while triggering few, if any, false alarms. Some implementations provide the warning when the system observes a lane crossing, which requires very little frame-to-frame processing and storage. Other implementations provide a prediction that a vehicle will cross a lane boundary within a time threshold, which incorporates the vehicle speed, trajectory, kinematic data from nonimaging sensors, and a model of the lane boundary to determine a time-to-lane crossing (TLC).6 Many vision-based lane detection methods use an edge detection algorithm in conjunction with other tools such as morphological filtering and frame-to-frame correlation to create an edge image of the painted lines, and a Hough transform applied to the edge image to define potential lane boundaries. The potential lane boundaries can be fitted to a geometric model for a roadway lane to eliminate the effects of spurious visual signals. An example of a simple road model is a straight line proposed in 1989.7 As research in this area has progressed, more sophisticated techniques such as snakes and splines have been proposed for modeling lane boundary shapes.8,9 Many algorithms have assumed that pavement edges and lane markings can be approximated by circular arcs on a flat ground plane,10–13 and several investigators have found it beneficial to use three-dimensional (3-D) models of lane boundaries.14,15 We now describe in more detail the algorithm proposed in Ref. 6 as one of the more sophisticated and recent techniques addressing this problem using a combination of computer vision, data fusion, and vehicle models. Their system comprises two modules: a data acquisition and elaboration module that analyzes the video frames to estimate TLC and a warning generation module that generates an alarm based on the TLC estimate. The primary focus of the paper is on the first module, wherein the lane geometry and vehicle position relative to the lane are estimated from camera frames. Referring to Fig. 1, the goal is to track and estimate the distance to lane crossing from estimates of lane geometry parameters (Xr, Yr) and vehicle trajectory parameters (Xv, Yv). Such a task is of course crucial to detect a lane departure because it provides unique information not derivable by other on-board sensors. This module includes two main phases: lane detection and lane tracking. Lane detection relies solely on video data and comprises five steps: (1) frame acquisition, (2) inverse perspective mapping (IPM), (3) edge detection, (4) line identification, and (5) line fitting. The second step, IPM, is a geometrical transformation technique that remaps each pixel of the two-dimensional (2-D) perspective view of a 3-D object to a new planar image corresponding to a bird’s eye view (see Fig. 2). In the third step, edge points are defined as the zero crossing of the Laplacian of the IPM smoothed image. Among all edge pixels, only stripes need to be detected, so an additional phase using steerable filters is employed in the fourth step. To further define the edges, a threshold is applied to binarize high-contrast transitions. In the fifth and final step, a parabolic model is used to fit curved lines to the edges, where the fit is performed using the random sample consensus procedure. In the second phase of lane tracking, Kalman filtering is used to update coefficients to the parabolic model. Nonimaging kinematic data are acquired from a steering angle sensor and an angular speed sensor mounted on a rear wheel. The kinematics are then combined into a vehicle model by using a data fusion algorithm. Given the nonlinear nature of the problem, Cario et al.6 employ both the extended and unscented versions of the Kalman filter. Roughly 5% of accidents in the United States occur when making intended lane changes. This type of intended lane departure is being addressed with an ADAS technology referred to as lane change assistant (LCA), which monitors adjacent lanes for the presence of vehicles; an alert is issued to the driver if a lane change is initiated and the neighboring lane is occupied.3 Many of the technical methods of LDW are employed in LCA, with the additional function of monitoring lateral views for the presence of vehicles. Computer-vision-based lane detection has been an active research topic for both LDW and LCA for at least the past decade. However, the numerous challenging problems encountered in addressing the totality of this important application, coupled with an aging population that would benefit from assistance, indicates that research and development will be needed in this field for some time. 2.2.Pedestrian DetectionMore than 39,000 pedestrians are killed and 430,000 are injured worldwide each year.16 A key goal of ADAS is the detection and avoidance of pedestrians. Pedestrian detection from the perspective of video surveillance with fixed cameras has been extensively studied, but many new problems arise when a camera is mounted on a common moving vehicle. The detection must comprehend a wide range of lighting conditions, a continuously varying background, changes in pose, occlusion, and variation in scale due to the changing distance. Many approaches have been proposed to address the detection problem. As the technology evolves, the various methods are being considered in concert to arrive at more robust solutions. Shape-, texture-, and template-based methods17–20 individually have difficulties with different appearances of pedestrians due to causes such as unknown distance, varying pose, clothes, and illumination changes. Motion detection is well suited for a pedestrian laterally crossing the visual field. Motion detection via a method such as optical flow21 can indicate a region of interest (ROI) that can be further analyzed for size, shape, and gait. The periodicity of the human gait is a strong indicator of a pedestrian and can be analyzed by clustering regions of pixels within the ROI as an image feature and tracking corresponding clusters frame to frame.22 Motion detection methods require multiple frames to be acquired and analyzed, do not comprehend stationary pedestrians, and can be confounded by changing background, changing lighting conditions, and longitudinal motion. Stereo vision addresses the problem of range and size ambiguity that occurs with monocular vision. Disparity maps are derived from the two views. The disparity provides information on distance that when coupled with detected features, such as size, edges, and bounding box dimensions, can be used to identify pedestrians.23 Recently, the more general problem of object detection and recognition has become a focus of attention in the computer vision community due to its widespread applications. Much progress has been made in this area in the past decade partly due to the introduction of various hand-designed features, such as scale invariant feature transform (SIFT),24 histogram of oriented gradients (HOG),25 local binary patterns (LBP),26 and maximally stable extremal regions (MSER),27 coupled with advanced machine learning techniques. Many state-of-the-art object recognition methods follow a process of first scanning the image at multiple scales with an object detection module and then applying a technique such as nonmaximal suppression to recognize objects of interest in the image. In the context of pedestrian detection, the work of Dalal and Triggs25 has made a significant contribution by introduction of the HOG feature. This was improved upon by Felzenszwalb et al.,28 wherein the authors describe a framework including detection of object parts and a statistically learned deformable model that relates these parts. The result was a significant improvement in both the accuracy of pedestrian detection and the extension to more general object recognition. Although computer vision approaches have made notable progress in pedestrian detection and recognition, there is still room for improvement in this arena, especially for critical applications that require very accurate responses in real time. Recent work29,30 suggests two major future research directions for pedestrian detection, namely incorporating context information for accuracy improvement and improving computational efficiency. By properly incorporating context information into the object recognition algorithm, the size of the search space and the false positive rate can be greatly reduced. In Ref. 29, local and neighborhood windows are first combined to construct a multiscale image context descriptor. This descriptor represents the contextual cues in spatial, scaling, and color spaces. An iterative classification algorithm called contextual boost is then applied to incorporate the designed contextual cues from the neighborhood into pedestrian detection. Other methods that incorporate scene context into pedestrian detection are also discussed in Ref. 29. Work in the area of improving computational efficiency includes Ref. 30, which presents a method that can perform pedestrian detection at 135 frames per second without degradation in detection accuracy. Two aspects are explored here. The first is in handling different scales needed for object recognition. Typical methods train a single (scale) object model at training time and apply it to resampled versions of the test image at all scales of interest at testing time. The computational burden heavily resides in the testing time and includes both the image resampling process and the recalculation of features at each scale. Instead, in Ref. 30, several object models (a fraction of all scales of interest) are generated during training. At test time, no image resampling is required, and only a part of the feature needs to be recalculated at each scale. In particular, the gradient of each pixel is the same since there is no image resampling. Only the histograms need to be recalculated at each scale. This shifts some computational burden from the testing to the training stage. Since only a fraction of all scales of interest is trained, the scales that match one of the trained models will be processed directly. The scales that do not match one of the trained models will be processed efficiently through interpolation between scales. As a result, it is possible to make a trade-off between the amount of computational burden allocated to the testing and training stages and the detection accuracy degradation due to interpolation. The other aspect explored in Ref. 30 is akin to incorporating scene context into pedestrian detection and uses an efficient stereo-vision method (stixel world model31) to detect the ground plane and limit the search space for pedestrians to only regions near the ground plane. An evaluation of the state of the art in monocular pedestrian detection was performed in Ref. 32. Key findings are that, despite significant progress in this area, performance still has significant room for improvement. The studies in Ref. 32 indicate that detection rate was low for partially occluded pedestrians and low image resolutions. Reference 32 provides several key elements that will aid in advancing this technology: a comprehensive richly annotated publically available data set, improved metrics and evaluation methods. Many recent systems use video sensing beyond the visible spectrum. Infrared (IR) sensors are finding civilian applications due to the decreasing cost of uncooled sensors. Far-IR (FIR) methods are based on the assumption that human body temperature is higher than that of the environment, resulting in pedestrians appearing sufficiently different in thermal brightness compared to their background in IR imagery, thereby aiding the step of pedestrian localization (see Fig. 3). Other objects that actively radiate heat (cars, trucks, etc.) can have a similar IR signature; however shape-, template-, and motion-based methods previously developed for visible spectrum imagery can be incorporated so as to aid in distinguishing people from warm objects. Another factor to consider is that IR imagery is less sensitive to lighting changes and to shadows than visible imagery.33 The topic of pedestrian detection is not strictly limited to walking humans. Reference 34 estimated that 1.5 million deer–vehicle collisions occur annually in the United States at a cost of nearly $1 billion in damages and resulting in over 200 human fatalities. Detection of animals such as deer, moose,35 and camels36 are all areas of active research, given the potential to prevent many serious accidents. Specialized bicycle detection methods37 are also a component of pedestrian detection. 2.3.Driver MonitoringAccording to the U.S. Department of Transportation’s National Highway Traffic Safety Administration (NHTSA), over 3,000 fatalities from automobile accidents are caused by distraction, and 100,000 crashes, resulting in 40,000 injuries and 1,500 deaths are caused every year by driver drowsiness.38 Government and private sectors have begun to invest significant effort to reduce such incidents. One example is the Driver Distraction Program Plan published by NHTSA in 2010, which serves as a guiding framework to eliminate accidents related to distraction.39 Computer vision and video processing technology can be leveraged to monitor driver behavior and attention and to alert the driver of the presence of unsafe conditions. Video capture is typically accomplished via cameras mounted or built into the vehicle. The use of mobile (e.g., smartphone) cameras as a portable monitoring system has also garnered recent attention. Approaches in the literature fall in three broad categories: (1) analysis of road conditions via a road-facing video camera, (2) analysis of the driver’s face from a driver-facing video camera, and (3) joint analysis and fusion of driver-facing and road-facing views. The previous sections have described prime examples in the first category of road-facing video analytics, namely LDW and detection of objects and pedestrians on the road. In this section, we complete the discussion by elaborating on driver-facing analytics and systems employing joint observations. Analysis of driver-facing video footage has engendered two threads of exploration, the first being drowsiness detection and the second being detection of driver attention by estimating the direction of the driver’s gaze. Drowsiness detection relies upon the fundamental ability to locate the driver’s eyes in a video frame and to determine the eye state, i.e., open versus closed. Eye localization is a form of object detection and conceptually follows the approaches of Sec. 2.2 but is tailored to detect the characteristics of human eyes. A common approach for determining eye state is to extract relevant features and train a binary classifier on closed-eye and open-eye samples. In Ref. 40, an active shape model helps localize the eyes, and speeded up robust features (SURF) features are used to train a binary support vector machine (SVM) classifier. A classification accuracy of 92% is reported on a data set of 1355 open-eye and 425 closed-eye samples gathered by the authors. In Ref. 40, a near-infrared (NIR) camera is used to capture driver-facing videos, thus enabling drowsiness detection under low light levels (e.g., at night) and in situations where the driver is wearing sunglasses. In that work, eye localization is followed by the extraction of four shape-based features: compactness, eccentricity, Hu’s seventh moment, and the ratio of the number of white pixels in the top hat transform of the eye region to that in the bottom hat transform. In addition, two texture-based features are calculated, namely histogram energy and contrast on the gray level co-occurrence matrix. A binary SVM classifier with a Gaussian radial basis function kernel is trained with this seven-dimensional feature representation. The authors report between 83 and 95% classification accuracy across seven video sets. Once eye state is determined, drowsiness indicators are computed such as percentage of eye closure over time40,41 or blink rate, which can be correlated with micro-sleep episodes.40 The second type of analysis performed on driver-facing video is monitoring driver attention by estimating eye gaze direction. Reference 42 addresses the problem by performing head pose estimation. A windshield-mounted camera sensitive to both visible and NIR light captures video footage of the driver. Head pose estimation is accomplished in three stages. First, Adaboost cascade detectors trained for frontal, left-, and right-profile images are used to localize the head and face region. Next, a localized gradient orientation (LGO) histogram is calculated as a facial feature descriptor, which is robust to scale, geometry, and lighting. Finally, support vector regression is used to learn a mapping from LGO features to two pose dimensions: pitch and yaw. Ground truth labels for training samples are gathered via an elaborate experimental setup with optical sensors attached to the driver’s head. Authors report mean absolute errors between 6 and 9 deg in pitch and yaw across different experimental conditions and demonstrate that these results are state-of-the-art. Note that head pose provides only an approximate indicator of driver attention and that a more accurate estimate needs to also consider eye gaze direction. Reference 43 reports an excellent general survey of vision-based eye gaze estimation techniques, grouping the approaches into three categories of feature-based (by far the most popular), appearance-based, and natural light methods. The application of gaze tracking to the specific problem of driver monitoring is indeed a fertile area for research. The ultimate goal in driver monitoring is to determine if the driver is paying attention to relevant objects and incidents on the road. Thus, while many research efforts to date have independently analyzed road-facing versus driver-facing video, we believe the next major advancement in driver monitoring is to be achieved via joint analysis and fusion of interior and exterior observations. A recent example of an effort in this vein is the CARSAFE mobile application.40 The authors propose dual video capture from the driver-facing (or front) and road-facing (or rear) cameras of a smartphone. Since current hardware limitations do not permit simultaneous capture on smartphones, the authors propose a system that automatically switches between front and rear cameras based on detection of various events. For example, detection of lane departure from the rear camera will prevent switching to the front camera. Conversely, if the system detects driver drowsiness from the front camera, it will force this camera to be the active sensor. The authors report overall precision and recall rates of 0.83 and 0.75, respectively, for detecting dangerous driving conditions. There have been efforts to employ nonvision sensing modalities for driver monitoring. Reference 44 proposes using the inertial sensors in a smartphone, namely the accelerometer, gyroscope, and magnetometer, to obtain position, speed, acceleration, and deflection angle and relate these to driver behavior. Researchers have also explored biosensors that measure photoplethysmographic,45 electrocardiographic,46 and electroencelographic47 data to predict drowsiness. When compared to vision sensors, these modalities have the benefit of reduced data bandwidth and processing requirements, and are arguably more direct measurements of a driver’s physiological state. However, they are expensive and require contact with the driver, which can be an inconvenience. In the future, we can expect to see research efforts that intelligently integrate input from multiple heterogeneous vision and nonvision sensors, global positioning system (GPS), and telematics to continuously monitor and alert the driver of dangerous conditions. Vehicle-to-vehicle and vehicle-to-infrastructure communication technologies will also play an important role in monitoring, predicting, and alerting drivers of unsafe situations. 2.4.Sensing for Other Adaptive and Warning SystemsComputer vision is contributing to a number of other adaptive vehicle driving systems and warning systems:
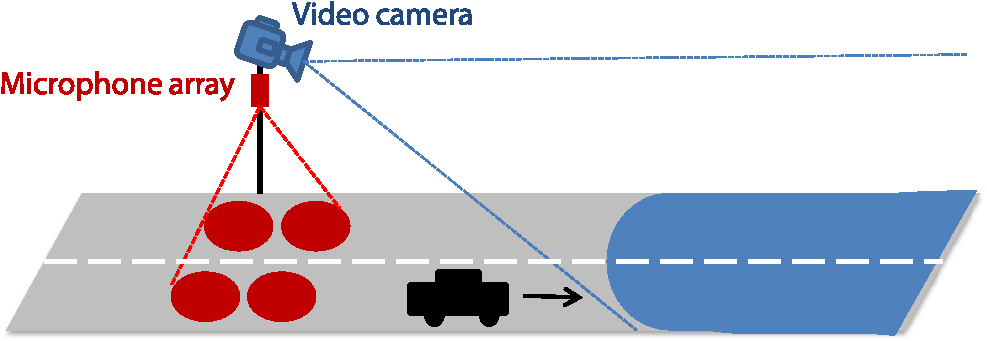
Other applications include blind angle monitoring, parking assistance, rear-view cameras, weather detection, autobending headlights, tunnel detection, and collision mitigation systems. A level of sensing and automation beyond driver assistance described thus far is embodied in the systems that enable autonomous vehicles, such as the much publicized Google driverless car. To date, Google’s fleet of autonomous vehicles have logged 450,000 driverless road miles. A key technology used in Google’s implementation is a roof-mounted Velodyne 64-beam laser, which creates a 3-D map of everything in the immediate area of feet. The 3-D image is combined with high-resolution maps that have been programmed into the vehicle’s control system. The laser system can differentiate between other cars, pedestrians, cyclists, and small and large stationary objects. Four radars (one for front, back, left, and right) sense any fast-moving objects from farther out than the laser can detect and are used to give the car far-sighted vision for handling high speeds on freeways. A front-mounted camera handles traffic controls and observes road signs and stop lights for information that a human driver typically uses. Other sensors include a GPS, an inertial measurement unit, and wheel encoder. While autonomous vehicle technology poses many challenges to current roadway legislation, it does offer great potential to mobilize citizens with impairments and could make driving safer due to comprehensive sensing and rapid decision making. For further details, the reader is referred to the recent IEEE Spectrum Online article.78 3.EfficiencyData derived from traffic volume studies can help local governments estimate road usage, volume trends, critical flow time periods, optimal maintenance schedules, as well as optimal traffic enforcement time periods. Real-time traffic flow data can also enable efficient incident management, which consists of incident detection, verification, and response. 3.1.Traffic FlowTraditional approaches to automated vehicle counting and traffic flow estimation include roadway sensors such as pressure hoses, piezoelectric sensors, and induction coils. These methods are typically inaccurate as well as difficult and sometimes expensive to deploy and maintain, as they have to be physically laid out on the target road or highway. Less intrusive roadway sensor systems such as sonar, microwave, and laser-based systems are sometimes employed, but they are expensive and highly sensitive to environmental conditions. Additionally, all roadway sensors have difficulty in detecting slow and stationary vehicles. However, the main downside of roadway sensors is that they provide limited information, namely vehicle count or traffic speed and/or volume alone. The application of computer vision techniques to the analysis of video sequences to assess traffic conditions, on the other hand, can be provided as a value-added option to already deployed traffic or surveillance camera network systems devoted to tolling and law enforcement (speed, red light, stop sign, etc.).79 Application of real-time processing of images and videos to perform road traffic data collection dates back to the early and mid-1970s at the University of Tokyo,80,81 where the authors developed a system to measure traffic flow and vehicle speed and length from real-time processing of videos. In England in the 1980s,82–88 members of the Traffic Research using Image Processing group developed a pipeline-based system for off-line measurement of vehicle count and speed. Belgian researchers89 developed the camera and computer-aided traffic sensor system, which estimated average traffic speed, vehicle length, and intervehicle gaps and performed vehicle classification. The Advanced Computing Research Centre at the University of Bristol devised a system capable of multilane vehicle counting, speed measurement, and tracking in complex traffic scenarios.90–93 Researchers at the Swedish Royal Institute developed a system that performed vehicle count and approximate speed estimation on roads with up to three lanes.94 A system developed at the Iran University of Science and Technology95 enabled automatic estimation of traffic queue parameters in real time. The capabilities of the system were later extended to enable real-time calculation of traffic parameters96 and traffic monitoring at intersections.97 A research group at University of California, Berkeley, produced a system capable of detecting and tracking multiple vehicles with robustness to occlusion while, at the same time, outputting vehicle shape parameters that can be used in vehicle classification.98–100 The University of Minnesota developed Autoscope,101,102 a system capable of measuring real-time traffic parameters. The outputs of the traffic analysis modules are input to a computer, which produces a virtual view of the road conditions. Autoscope also has a traffic controller module capable of manipulating traffic lights and managing variable message signs. Reference 103 proposed a hybrid method based on background subtraction and edge detection for vehicle detection and shadow rejection, based on which vehicle counting and classification, as well as speed estimation in multilane highways, is achieved. The MODEST European consortium introduced Monitorix,104 a video-based traffic surveillance multiagent system where agents are grouped in tiers according to the function they perform. The authors of Ref. 105 introduced a model-based approach for detecting vehicles in images of complex road scenarios. They attempt to match image features with deformable geometric models of vehicles in order to extract vehicle position, pose, and dimensions from which they can extract vehicle speed, count, and junction entry/exit statistics. In order to minimize the number of cameras used to monitor traffic within a city, Ref. 106 presented a novel strategy for vehicle reidentification, which matches vehicles leaving one monitored region with those entering another one based on color, appearance, and spatial dimensions of the vehicles. Reference 107 presented a prototype of a smart camera with embedded DSP implementations for traffic surveillance. An algorithm that calculated queue length and flow across intersections via a back-propagation neural network was proposed in Ref. 108. Reference 109 proposed a video analysis method for vehicle counting that relies on an adaptive bounding box size to detect and track vehicles according to their estimated distance from the camera, given the geometrical setup of the camera. The authors of Ref. 110 proposed a vehicle counting method based on blob analysis of traffic surveillance video. A three-step approach consisting of moving object segmentation, blob analysis, and tracking is described. Reference 111 proposed a video-based vehicle counting method based on invariant moments and shadow-aware foreground masks. Background estimation for foreground segmentation is performed with a mixture of Gaussian models, as well as with an improved version of the group-based histogram. Shadow-aware foreground detection is achieved by performing background subtraction with shadow removal in the hue, saturation, and value color space. Vehicle classification is performed by computing moment invariants of the foreground mask; moment invariants are properties of connected components in binary images that are invariant to translation, rotation, and scaling, and can be used for shape classification and coarse object recognition. More recently, Ref. 112 proposed a video-based vehicle counting scheme that operates on the compressed domain by analyzing the magnitude, stability, and coherence of clusters of motion vectors associated with vehicles passing by a virtual sensor. Given that video compression is usually performed in real time on embedded camera hardware, and since building the vehicle counting capabilities into the compression step only adds a small amount of computation, the proposed approach is conducive to real-time performance. The authors report achieving a false positive rate of 3.4% and a false negative rate of 2.3% with the proposed method applied to a variety of videos shot under different conditions, frame rates and resolutions. Traffic flow estimation was one of the problems first addressed by automated video analytics, and, as such, it garnered significant attention in the early years of the technology. Recently, however, the scholarly literature on this topic has diminished. A possible explanation is that the field has evolved from a phase of basic research to one of commercialization in practical applications, such as congestion management and prediction, and that most of the attention is now being devoted toward enabling real-time implementations that achieve levels of performance matching or exceeding industry requirements. 3.2.Incident ManagementAn incident is defined as “an event that causes blockage of traffic lanes or any kind of restriction of the free movement of traffic.”113 Examples of incidents include stalled vehicles, accidents, road debris, and chemical spills. Reports estimate that in 2005, traffic incidents incurred a cost of $6.9 million vehicle-hours and 7.3 million of gallons of fuel.101 Studies show that accidents and disabled cars account for 20% of all causes of congestion on metropolitan expressways.114 Effective incident management from detection through response is required. Incidents are classified into two categories: primary and secondary. Secondary incidents are those caused by preceding or primary incidents. It is estimated that anywhere between 20 and 50% of all freeway accidents are secondary,115 which highlights the importance of early discovery and clearing of primary, abnormal incidents. Research on incident detection and incident prediction dates back to the early 1990s when a system that detected extraneous objects obstructing tunnels and tight curves in roads was introduced.116 Two years later, a method based on image processing and fuzzy techniques that attempted to predict an incident before its occurrence was proposed.117 Guidelines for incident detection were presented in the framework of the DRIVE V2022 Euro-Triangle project.118 Reference 119 proposed breaking down incident detection into micro- and macroscopic detection; the former related to incidents that occur within the field of view of the camera, while the latter is inferred from aggregated traffic flow parameters. A novel architecture for developing distributed video networks for incident detection and management was introduced in Ref. 120. A camera-based incident detection system to automatically detect slow-moving or stopped traffic on traffic lanes and shoulders was described in Ref. 121. More recently, a video-based incident detection system was deployed and tested on cameras monitoring the San Mateo Bridge in the San Francisco Bay Area.122 The system was effective in detecting incidents on both traffic lanes and shoulders, regardless of traffic and weather conditions and time of day. Recognizing that the accuracy of video-based automatic incident detection is heavily affected by environmental factors such as shadows, snow, rain, and glare,123 reviewed existing compensation techniques and highlighted potential research directions to address the lack of robustness of existing systems to such factors. Reference 124 presented a framework for real-time automated recognition of traffic accidents based on statistical logistic regression analysis, which records the trajectories of vehicles involved in accidents as guidelines for investigators. Reference 125 presented robust incident detection systems based on the fusion of audio and visual data captured by hybrid systems that included video cameras and microphone arrays, as illustrated in Fig. 5. While traditional video-based vehicle detection and tracking was implemented, improved performance was achieved by introducing sophisticated algorithms that support fusion of multiple, asynchronous sources of data. This resulted in a system that offered improved robustness to varying environmental conditions relative to traditional vision-based systems, as well as increased area coverage relative to traditional microphone arrays. The authors present exemplary vehicle detection outputs achieved by the system under extreme weather conditions such as heavy fog, which would render a traditional vision-based system inoperable. The asynchronous nature of the data sources resulted from the nonoverlapping operating areas of each of the systems (see Fig. 5); synchronization of data sources was achieved by predicting the time it would take a vehicle to traverse the blind area between the two disjoint coverage areas via video-based speed estimation and knowledge of relevant sensor geometry parameters and scene dimensions. The system was successfully applied to the detection of stranded vehicles, traffic jams, and wrong-way driving episodes on Austrian highways. We expect the ever-increasing sophistication of low-level video analytic algorithms devoted to motion detection and object tracking coupled with advanced machine learning techniques to contribute to the increased automation, robustness, and self-sufficiency of incident detection systems. This, in turn, should be reflected in shorter response times and improved efficiency and performance of first-responder entities and personnel. 3.3.Video-Based TollingAutomated open road tolling (ORT) or free-flow tolling refers to the collection of road use fees without the need for physical toll booths. The idea of using wayside electronic transponders to record vehicles passing specific points on roads for the purpose of tolling was first proposed in 1959.126 The advantages of automated tolling technology include improved customer service, network operations, congestion management, and pricing.127 An advantage of video-based tolling systems is that, since toll fees typically vary across different vehicle types, such systems can seamlessly be extended to perform vehicle classification tasks. Video-based tolling is based on high-speed image capture and license plate recognition technologies, and is typically implemented in conjunction with other vehicle classification systems, typically based on the use of transponders such as radio frequency identification (RFID) devices. The downside of RFID-based systems is that they require compliance from drivers, as they require specifically designed tags or transponders to be carried or installed in the vehicles. The first video-based tolling system deployed in North America (along Highway 407 in the greater Toronto area) uses a video module to determine the entry and exit points of a vehicle and performs license plate recognition and billing based on time, distance travelled, and vehicle type. A database of video accounts is then built by matching the recognized license plate numbers with the driver and vehicle information.128 A similar system is in place in the state of Virginia, where a license plate recognition system is used to capture images of license plates of vehicles without a valid transponder that pass through a toll point, as illustrated in Fig. 6.129 Starting in February of 2003, the city of London has charged a fee for driving privately owned vehicles in its central area during weekdays as a way to reduce congestion and raise revenue.130 A network of video cameras records license plate numbers and matches it with a list of customers who have made a payment in advance. The owners of vehicles that have not paid the congestion fee are sent a fine. Similar camera-enforced pricing systems for congestion avoidance exist in Stockholm131 and Singapore.132 The Texas Department of Transportation deployed the pay-by-mail system in the fall of 2006, which allows drivers who do not possess a Texas toll tag to use electronic toll collection facilities that perform tolling based on license plate recognition systems. The drivers receive a monthly bill in the mail via the vehicle registration data linked to their license plate.133 Systems that require the driver to call in advance and register his/her license plate number into a database exist in Melbourne, Australia,134 and Santiago, Chile.135 The driver gets billed when the system’s video cameras pick out their license plate number while in transit. Video analytics technologies have also been used in Austria since 2004 and in Germany since 2005 to enforce road-usage fees for freight vehicles.136 Fig. 6License plate recognition system used to identify vehicles without a radio frequency identification transponder.129  Video-based toll collection has driven the expansion of high-occupancy vehicle (HOV) lanes to high-occupancy toll (HOT) lanes in certain U.S. states such as California, Texas, Georgia, and Minnesota.137 In HOT, the assessed toll is a function of the number of occupants in the vehicle. For both HOV and HOT applications, enforcement is very difficult and is typically performed by police officers detaining and visually inspecting vehicles. Enforcement rates of 10% are often quoted where actual violation rates can be of the vehicles using the HOV lane. Computer vision techniques are being introduced to automate or semiautomate the enforcement process.138–140 Reference 140 recently proposed a classifier-based imaging and face detection method of enforcement. Successive mean quantization transform (SMQT) features are chosen due to their relative insensitivity to illumination variations. SMQT consists of a series of simple operations. First, the mean of the pixels in a pixel region surrounding the pixel of interest at location () is calculated. Next, those pixels with gray values above the mean are set to 1 and all others to 0. The result is a 9-bit pattern of zeros and ones (one bit per pixel in the local region) with 512 possible patterns associated with the pixel of interest. This 9-bit pattern can be described as a binary nine-dimensional feature vector corresponding to pixel location (). This process is repeated for all pixels within an frame where image classification is to be performed. The features are then fed to a classification technique referred to as sparse network of winnows (SNoW) that classifies “face” versus “no-face” regions in the passenger position of the front seat. SNoW employs linear classification in a very high-dimensional sparse feature space and can be described mathematically as where is the ’th element (0 or 1) of feature vector , is a weighting factor that is learned during the training phase using an iterative update rule, and is the class label. Using SMQT and SNoW, Ref. 140 was able to achieve a 3% error rate (false violator) and a 90% true positive rate on a data set where passengers were generally facing forward. Figure 7 shows sample output images illustrating the classification performance of the proposed approach.Fig. 7Face classification in seat passenger positions: red—classified as face, green—classified as no face.140 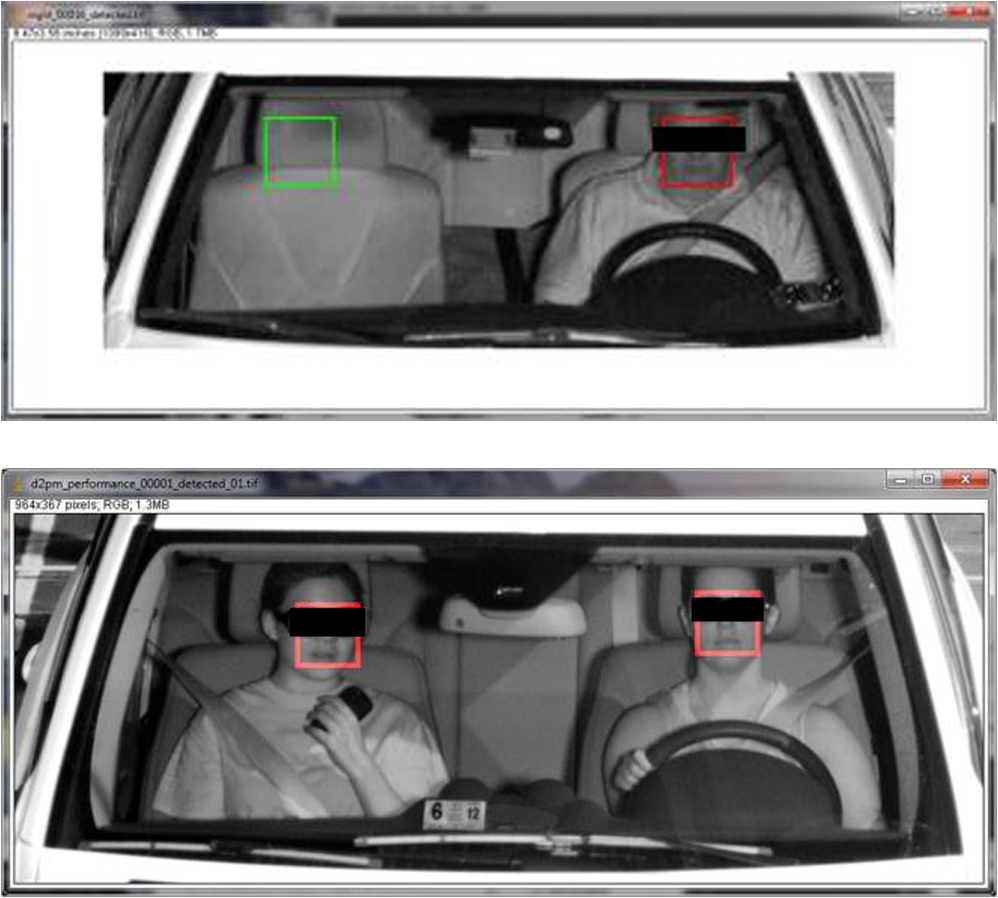 Given their flexibility and scalability, we expect video-based toll collection technologies to gradually supersede RFID and tag-based solutions as the technology of choice to satisfy the ever-increasing need for ORT. First, the transition would eliminate the need for voluntary enrollment at the customer end, thus significantly enhancing the penetration rate and pervasiveness of the technology; note that participation level is an important parameter in transponder-based tolling because processing costs of nontransponder transactions are significantly higher than the cost of transponder transactions. By migrating to video-based solutions, this level of dependence on the willingness of the drivers to ascribe to a given technology is ameliorated. Operational and maintenance costs of automated tolling technologies should also decrease as there would be no need to distribute and manage transponders, manually process payments and disputes, pursue nonpayers, etc. Lastly, current and future applications such as vehicle classification for efficient routing and automated rate selection from vehicle type, automatic collection of evidentiary imagery and footage, as well as variable toll rates (based, for example, on level congestion, occupancy, time of day, day of week, etc.) would be readily supported. 4.Security and Law EnforcementComputer vision technologies are playing key roles in the areas of transportation security and law enforcement. There are several common elements shared by computer vision systems aiming to meet security or law enforcement needs. For example, the detection and identification of events of interest is an important capability common to both security and law enforcement. On the other hand, there are also several distinct characteristics that separate a security application from law enforcement. For example, prediction and prevention are important for security applications while accuracy and evidence are important for law enforcement. In many cases, a security system can serve as a front-end of a law enforcement system. For example, in order to enforce certain traffic violations, it is necessary to detect and identify the occurrence of such an event. Below, we focus on several example applications within these two broad categories to elucidate the general principles. 4.1.SecurityVideo cameras have been widely used for security and surveillance for quite some time due to their low cost, ease of installation and maintenance, and ability to provide rich and direct visual information to operators. The use of video cameras enables centralized operations, making it possible for an operator to coexist at multiple locations. It is also possible to go back in time and review events of interest. Many additional benefits can be gained with a video sensing and recording modality using computer vision technologies. Consider that, traditionally, the output of these cameras has been viewed and analyzed in real time by human operators and is archived for later use if certain events have occurred. The former is error prone and costly, while the latter has lost some critical capabilities such as prediction and prevention. Computer vision and assistance, and extraction of video analytics, are of great research interest to fully reap the benefits of video sensing. 4.1.1.Alert and warning systemsIn some applications, very rapid analysis of large video databases can aid a critical life-or-death situation. Amber Alert is an emergency alert system to promptly inform the public when a child has been abducted. It has been successfully implemented in several countries throughout the world. When sufficient information is available about the incident (e.g., description of captor’s vehicle, plate number, color, etc.), a search can be conducted across large databases of video that have been acquired from highway, local road, traffic light, and stop sign monitoring, to track and find the child. Similar to Amber Alert and much more common is Silver Alert, which is a notification issued by local authorities when a senior citizen or mentally impaired person is missing. Statistics indicate that it is highly desirable that an Amber/Silver Alert–related search is conducted in a very fast and efficient manner, as 75% of the abducted are murdered within the first three hours. Consider a statement from the West Virginia code on Amber Alert 15-3A-7: “the use of traffic video recording and monitoring devices for the purpose of surveillance of a suspect vehicle adds yet another set of eyes to assist law enforcement and aid in the safe recovery of the child.” Recent advances have been made in efficiently searching for vehicles in large video databases through an adaptive compression and compatible decompression method.112 Rather than selecting reference compression frames in a conventional manner at fixed time intervals, Ref. 112 selects reference frames as those where vehicles are in an optimal viewing position. Thus, the vehicles captured across many hours of video can be viewed by only decompressing the reference frames, as illustrated in Fig. 8. By performing reference frame selection based on the particular video content, the algorithm from Ref. 112 narrows down the search space relative to conventional approaches. Although this reduction in search space size is dependent on traffic conditions, it works best in low- and medium-traffic volume scenarios; the boost in efficiency can be significant in subsequent search tasks relative to the naïve approach where reference frames are inserted at fixed rates. Beyond the specific application of efficient video search and retrieval, Ref. 112 introduces a potential paradigm shift away from the traditional approach whereby computer vision–related tasks are performed on uncompressed images and video. By exploiting the feature-rich nature of compressed data, the proposed framework incurs negligible amounts of additional computational expenses on top of what is required for video compression. Since motion-compensated video compression can be performed in real time on embedded hardware found in most internet protocol (IP) cameras, the gap to real-time performance of computer vision tasks is significantly bridged by operating in the compressed domain. 4.1.2.Traffic surveillanceComputer vision in the context of traffic surveillance addresses problems such as vehicle/pedestrian detection, tracking, traffic flow measurements, and the representation, understanding, and prediction of human behavior (e.g., anomalous incident detection, illegal turns, aggressive driving patterns, etc.). Several of these applications have been discussed in detail in earlier sections. Here, we focus on the overall system through the sampling of several survey papers in human and/or traffic surveillance79,141–146 with an emphasis on research efforts in behavior representation, understanding, and prediction. A general discussion framework used by papers on human and traffic surveillance is to categorize vision tasks into three stages:
However, in the literature, different categorization boundaries, different focuses, different methods of grouping these technologies, and different levels of detail are presented. In this paper, our discussion follows a three-level framework similar to that used in Ref. 144. Figure 9 shows an illustration of an exemplary hierarchy of three-level computer vision tasks and the corresponding information needed in traffic surveillance applications. A typical traffic surveillance system would start with object detection and tracking, i.e., the low-level computer vision task, as described in Sec. 2.2. At this level, the amount of information needed is smaller compared to other levels. Detecting an object of interest can often be performed via pixel intensity changes over time such as frame-to-frame differences, statistics of local pixel intensity over time such as a Gaussian mixture model for background subtraction, or motion analysis using motion vectors or optical flow. Other machine learning and pattern recognition methods can be used to directly detect a specific type of object such as a vehicle (see Sec. 4.1.3), but the computation of these methods tends to be more costly. Once the object of interest is detected, many tracking methods, such as mean-shift, feature or template matching, etc., can be applied to follow the object of interest. Tracking yields trajectories of the objects of interest. For interested readers, an excellent review of computer vision technologies on object detection and tracking can be found in Ref. 147. At this level, many traffic flow measurements such as vehicle count, average traffic speed, etc., become readily available. However, for further traffic surveillance needs such as access control, illegal turn detection, and incident or anomaly detection, we need to move to the middle level where the dynamics or patterns of these trajectories are understood and analyzed. Understanding trajectory dynamics or patterns often involves grouping and classification. Machine learning techniques are well suited for this task. A common approach is to first perform clustering in the training phase based on some form of distance or similarity measure. At the highest level of the hierarchy, the resulting clusters are then modeled to represent the behavior of each cluster. As new trajectories are identified from the traffic scene, they are compared to these models for discovery of events of interest such as incidents, anomalies, etc. For more complicated behavior, the interaction among the behavior of a group of individuals may also need to be examined and modeled. Note that this does not mean that one can blindly apply known machine learning techniques and have success; additional domain knowledge and contextual knowledge about the scene and rules are fairly critical for traffic surveillance. For example, not all vehicles would travel at the exact same speed within the field of view of the surveillance camera. As a result, the number of samples of the different trajectories may not be the same. Hence a normalization step is generally needed prior to the estimation of the traveled distance in the clustering step. For another example, a stop-and-go trajectory pattern is considered normal at an intersection with a stop sign while the same pattern is an indication of traffic congestion at a highway segment. In this case, some rule-based reasoning or additional contextual information about the scene needs to be provided and taken into account in the clustering or behavior modeling. Fig. 9Illustration of an example of three-level computer vision tasks and the corresponding information needed in traffic surveillance applications. Note that this figure is a modification of Fig. 1 in Ref. 144. 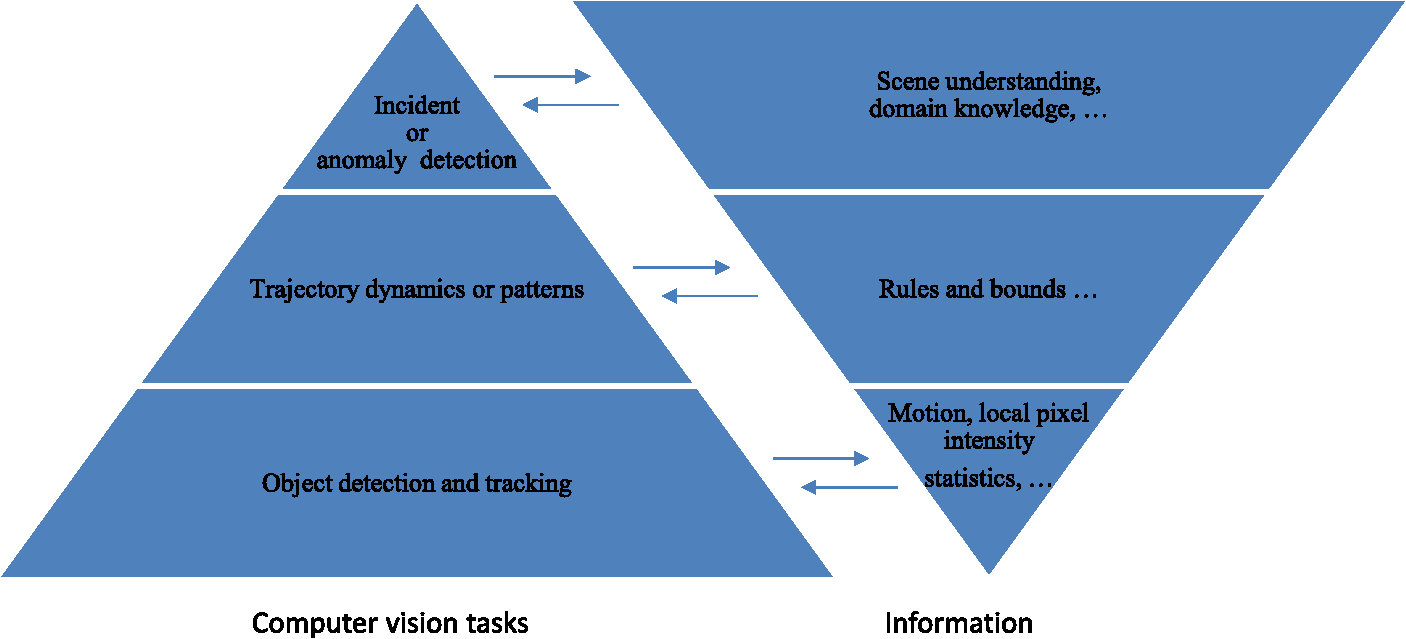 It is clear that trajectory analysis lies at the heart of many of the approaches in the middle and higher levels of the surveillance hierarchy. A general discussion on vision-based trajectory learning for surveillance can be found in Ref. 144. Furthermore, in the broader context of surveillance, many existing methods such as dynamic time warping, finite-state machine, hidden Markov models, time-delay neural network, syntactic techniques, nondeterministic finite automaton, self-organizing neural network, etc., have been applied for behavior understanding.145 Thus, advances in the high-level vision tasks for traffic surveillance are promising. Recently, Ref. 146 presented a thorough review on computer vision techniques for urban traffic surveillance, where commercial systems in use and computer vision techniques used in traffic analysis systems are reviewed; the state of the art for prototype and academic systems is analyzed, and detailed discussions and an outlook to future research are provided. The survey highlights key differences between urban traffic surveillance and highway traffic surveillance. As would be expected, urban traffic surveillance is much more challenging than highway surveillance due to the complexity of scene and road usage. For example, for a highway scene as compared to an urban scene, vehicle trajectories have fewer and simpler patterns, pedestrian detection (see Ref. 148 for a survey in this area) and analysis of vehicle–pedestrian interactions are generally not necessary or critical, and occlusion is not as challenging. Another interesting discussion in Ref. 146 is the comparison between two surveillance system methodologies. Earlier systems are likely to follow a framework where object tracking is done without knowledge of object classes (thus, being simpler and faster). With the advances in computer vision and computation, a framework where knowledge of object classes is available prior to tracking has become more promising in solving more challenging tasks. The latter framework has more potential for better performance (accuracy, robustness) at the expense of more processing. Since these systems need to operate in real time or near real time in practice, the choice between the two frameworks is not straightforward and is likely to be application dependent. We elaborate now on the problem of anomalous incident detection, which is at the highest level of the hierarchy. Examples of transportation anomalies include traffic violations, accidents, dangerous pedestrian–driver behavior, unattended baggage at public transportation sites, etc. An excellent survey of video anomaly detection techniques can be found in Ref. 149. The approaches can be broadly categorized into supervised methods, where both normal and anomalous events are classified, and the more realistic unsupervised scenario, where class labels are available only for normal events. In the supervised case, anomaly detection therefore reduces to a classification problem, while in the unsupervised case, the problem is one of outlier detection. In the transportation domain, many anomaly detection approaches leverage the aforementioned advances in object tracking to define normal and anomalous events in terms of vehicle trajectories. A recent development in this area is the use of sparse reconstruction techniques for detecting anomalous vehicle trajectories.149,150 An over-complete dictionary comprising normal trajectory classes is first constructed in a training phase. The trajectory classes can either be labeled manually using semantic categories or derived via an automatic unsupervised (e.g., clustering) technique. The hypothesis is that any new normal trajectory should lie within the linear span of other normal trajectories within the same class and thus can be reconstructed by combining a relatively small number of dictionary elements. Equivalently, the reconstruction coefficient vector is sparse, as is illustrated in Fig. 10. Fig. 10Sparse reconstruction for anomaly detection: is a test trajectory vector; is the training dictionary; and is the sparse reconstruction coefficient vector.  Conversely, reconstruction of anomalous trajectories is likely to involve a larger number of dictionary elements, potentially across multiple classes, and therefore the reconstruction vector would not be sparse. Anomaly detection therefore reduces to sparse reconstruction of a test trajectory with respect to the training dictionary, followed by a method of measuring sparsity. Reference 149 presents a formulation for single-object events. Reference 150 extends the sparsity framework to joint modeling of multiobject events and furthermore introduces a kernel to improve class separability. Both techniques accomplish sparse reconstruction via L1 norm minimization. Since anomaly detection algorithms reduce to a binary decision (i.e., is the event an anomaly or not?), a standard method of evaluating algorithm performance is to report the confusion matrix of false- versus true- positive and negative samples. Table 4 compares confusion matrices obtained from the joint sparsity model150 with another well-recognized algorithm in Ref. 151 that employs a one-class SVM classifier on vehicle trajectories. The data set used to train and test the approaches is a collection of vehicle trajectories obtained at a stop sign intersection. Vehicles coming to a complete stop at the intersection are labeled as normal events. The goal is thus to flag stop sign violations as anomalous events. The sparsity-based method is shown to significantly outperform that of Ref. 151, especially in the presence of occlusions. Table 4Confusion matrices for the joint sparsity and single-class support vector machine anomaly detection techniques on stop sign intersection data. Columns indicate ground truth, and rows indicate detected outputs.
A recent thread of exploration in anomaly detection is to employ holistic event representations such as spatiotemporal volumes40 in favor of trajectory representations. The main advantage with this approach is that the performance of anomaly detection is no longer sensitive to the accuracy of object trackers, many of which fail in the presence of occlusions and other types of noise. On the other hand, such holistic approaches are likely to involve higher computational cost. Another significant challenge in anomaly detection is the lack of standardized benchmark data sets, especially ones that include ample anomalous events in complex realistic scenarios. In summary, many computer vision techniques have been applied for traffic surveillance and human surveillance. In recent years, there have been great advances at all levels, low, middle, and high. However, large gaps remain in the regime of high-level computer vision tasks such as behavior understanding and prediction, especially in realistic scenarios where many sources of noise abound such as occlusion, clutter, varying illumination, shadows, etc. We expect more focus in this area in the future. Fusion technologies for integrating information from multiple cameras or multiple modalities of traffic sensing could gain (and have indeed gained) more attention as well. 4.1.3.Vehicles of interestRecognizing and tracking vehicles of interest requires computer vision technologies in the areas of vehicle detection, classification, and recognition. Classification and recognition are often required at different degrees of granularity for different applications, ranging from coarse (e.g., distinguishing small- versus large-size vehicles) to more detailed vehicle type classification [e.g., sedan versus sport utility vehicle (SUV) versus van], to the unique identification of a vehicle (e.g., through recognizing the alphanumeric information of a license plate). A brief review of camera-based vehicle detection can be found in Ref. 152, where methods based on technologies such as fuzzy logic, contour matching, sensor fusion, SVM, etc., are briefly discussed. In Ref. 153, Garg examined various vehicle detection methods using image features such as SIFT, principal component analysis–based, edge-based, and Haar-like features. As expected, traditional machine learning and image segmentation techniques can be adapted to perform the “car versus noncar” segmentation task. The choices of image features and classifiers, however, play an important role in its performance. Motion and size cues can often be utilized to improve computational efficiency and robustness. Note that due to complications introduced by environmental conditions, e.g., shadow, occlusion, and other factors, there are still many open questions for researchers to explore. The dominant technology used for vehicle classification relies on the use of light curtains, which provide a 3-D profile of a vehicle via line illumination and sensing in a direction perpendicular to traffic flow.154 More recently, vision-based methods are being explored due to their multifunction capability and increasing prevalence of roadway cameras. These techniques have attained different levels of class granularity. The classification methods employed depend greatly on the goals and conditions of the application. Here, we highlight a few examples to introduce and review the field. One popular class of approaches uses 3-D vehicle models as templates for vehicle classification.155,156 In Ref. 156, Leotta and Mundy use a generic but more detailed 3-D vehicle model that deforms to match a wide variety of passenger vehicles. The model parameters are adjusted to best align the 3-D representation with acquired images by predicting and matching image intensity edges. Vehicle class is determined by examining the fitted model parameters. Experiments were performed for a five-class problem (two-door sedan, four-door sedan, minivan, SUV, pickup truck) and a simpler three-class problem (sedan, minivan/SUV, and pickup). Their results showed that their method outperforms methods using simpler deformable 3-D models (e.g., see Ref. 155) for basic vehicle classification. Other methods not employing 3-D models use heuristic rules (size, aspect ratios, etc.) or supervised training. In Ref. 157, Lai and Yung use a virtual loop concept to replace the functionality of actual inductive loop detectors (ILDs) with video analysis of motion vectors of the virtual loops. The underlying vehicle-type classification method is the same as that used by ILD, which is a vehicle length–based approach of looking at the one-dimensional signature of the output of ILD. As a result, the classification capability is more limited compared to the deformable template method of Ref. 156. Vehicle shape and appearance have been used as features for classifying SUVs, vans, pickup trucks, and cars from aerial videos.158 Features based on edge points and modified SIFT descriptors have been used as inputs to vehicle classifiers in Ref. 159, where the authors show promising results for classifying car versus minivan or sedan versus taxi (a subclass classification) with a supervised machine learning approach. The most popular approach for recognizing vehicles of interest especially in law enforcement is license plate recognition (LPR) since it uniquely identifies vehicles, except those with illegal or inappropriate use of plates. Ideally, given the alphanumeric information of a plate, detailed vehicle information can be derived, such as type, make and model, approximate color, etc. A thorough review of LPR technologies is found in Ref. 160. There are generally three basic steps: (1) plate localization, which detects the region containing the license plate within the image; (2) character segmentation, which marks the boundaries separating individual characters within the plate image; and (3) character recognition.160 For the first two steps, Ref. 160 categorized various methods based on the image domain, where the algorithm involves, e.g., binary processing, gray-level processing, color processing, etc. For the final step, two categories are described in their discussion: classifier and pattern/template matching. In addition, many applications require identification of the originating jurisdiction (e.g., state or province). State-of-the-art LPR performance can again be broken down by the three steps. For plate localization, Ref. 160 reports results from a variety of publications, with most methods achieving localization accuracy. For character segmentation, Ref. 160 states a minimum license plate height requirement of 20 to 25 pixels for successful results and remarks that most failures in the third stage of character recognition are actually due to failed segmentation. For character recognition, Ref. 160 reports results from a variety of published techniques with performance varying from 92 to 98%. While there are currently many commercially available LPR systems, and many of the seemingly encouraging results mentioned above are reported under nominal or favorable conditions, much research continues to be conducted on all three of the aforementioned steps to improve LPR performance and robustness under a wide range of practical situations. Recently, Refs. 140 and 161 proposed a classifier-based approach for character recognition using SMQT features and the SNoW classifier (described in Sec. 3.3) to achieve robust performance under widely varying illumination conditions. Classification performance reported in Ref. 140 is shown in Fig. 11. The results are shown in terms of receiver operating characteristic (ROC) curves conveying the tradeoff between yield (percentage of characters for which a conclusive decision is made) and accuracy (percentage of correct decisions). A given curve is generated by sweeping a minimum threshold for the classifier margin that must be exceeded for a decision to be deemed conclusive. The SNoW technique in Ref. 140 is compared with another state-of-the-art character recognition algorithm that employs a nearest-neighbor data-driven approach162 on two license plate designs from the states of Maryland and California. We see from this plot that (1) performance can vary considerably depending on the plate design; (2) the SNoW technique exhibits superior performance over the nearest-neighbor approach; and (3) at a yield of 95%, both methods achieve accuracy on both data sets. Fig. 11Receiver operating characteristic curves for the SNoW classifier140 versus the data driven classifier162 for Maryland (MD) and California (CA) license plates.  A practical challenge in LPR is the tradeoff between the two competing needs of large field of view (needed for applications such as traffic flow monitoring) and high spatial resolution (needed for plate localization and character recognition in LPR). A potential approach would be to leverage the advances in superresolution from a series of images to relieve the image resolution requirement in settings where the camera must have a wide field of view. A recent approach that partially addresses this problem computes a signature of a license plate image and uses search-retrieval techniques to compare the signature against a database of previously gathered vehicle plate images.163 This method uses a similarity learning technique to derive an optimal distance metric for accurate and robust signature search and retrieval. Since it does not depend explicitly on recognition of individual plate characters, the resolution requirements can be somewhat relaxed. Note however that this system can only recognize plates it has seen before (i.e., that are present in the database) and therefore lends itself only to certain applications such as Amber Alert discussed in Sec. 4.1.1. Yet another practical challenge in deploying an LPR system is that due to the numerous imaging distortions encountered in camera capture of license plates, and due to the significant variety of plate designs found in some countries (e.g., USA), a very large number of images representing this variety must be gathered in order to successfully train and optimize the system. This can significantly increase the time and cost of deployment. Reference 164 proposes a solution to this problem by generating synthetic license plate images for training LPR. Synthetic images are designed by overlaying characters designed with realistic plate fonts on background blank plate images gathered from public sources. These images are then subject to a series of imaging distortions that have been systematically derived by analyzing real images. Figure 12 compares synthetic and real camera captures for a New York state license plate; Fig. 13 shows three types of imaging distortions generated via simulation. Experiments in Refs. 163 and 164 show that a large volume of synthetic images can be used to augment a small training set of real plate images to produce excellent LPR performance while significantly reducing the time and effort in gathering training data. In summary, there are two broad types of vehicle identification approaches: a nonunique identification/vehicle classification and a unique identification via LPR. In many applications, vehicle classification is sufficient. The higher the granularity of classification, the more technical challenges need to be overcome. Current state-of-the-art154 uses the 3-D profile of a vehicle acquired by light curtain sensors and yields 98.5% accuracy across 2.3 million vehicles while performing vehicle classification to a fine scale. There is still a large gap for video-based approaches to accomplish a degree of performance equivalent to that achieved by the light curtain approach. One alternative we believe to be promising entails the extension of the 3-D model work in Ref. 156 from single-view to multiview architecture. This would clearly close the performance gap between video-based approaches and the state-of-the-art. In practice, research questions such as what is the minimal number of views needed, what would be their optimal configuration, and how to make the system computationally efficient need to be addressed. In the case of LPR techniques, although the technologies are quite mature, there are still many challenges in practice. The development of methods with fast adaptation to a given set of requirements is an important direction in real-world deployments. While Refs. 163 and 164 are moving toward this direction, we expect to see more formal domain adaptation techniques from the machine learning literature being brought to bear on this problem. Other interesting research directions include internationalization, i.e., the ability to recognize plates and characters across a wide variety of countries; performing LPR from cameras mounted on a mobile platform such as that done in police cars (see Sec. 4.2.3); and recognition of other numerical identifiers such as the US Department of Transportation number on commercial vehicles. A standardized evaluation protocol for assessing an LPR system would also be of great value for real-world applications. In addition to the applications described above, computer vision technologies can be/have been applied to many other transportation-related security applications. For example, detection of hazardous material (hazmat) signs on vehicles can help first responders take appropriate action in an emergency situation. Surveillance cameras along with specialized acoustic analyzers of .gunshots have served as shot trackers. Many other examples are currently being pursued, and we expect vision-based technologies for ITS will flourish for years to come. 4.2.Law EnforcementThe description of violations in law enforcement applications is typically defined a priori and readily available for system designers. This contrasts with security applications, where the abnormal/incident behavior may not be clear and needs to be learned. On one hand, this prior knowledge simplifies the problem, while, on the other hand, accuracy, certainty, and identification are critical for law enforcement. Speed enforcement is a prime example demonstrating the need for very high accuracy. More details are discussed in the following section. Technologies for LPR and sometimes also for human identification are critical for law enforcement since the correct violators need to be held responsible. 4.2.1.Speed enforcementStudies165–168 have shown a strong relationship between excessive speed and traffic accidents, and the impact of speed enforcement in reducing speeding.165,169–175 Consider the following statistics on the impact of speeding: in the United States, in 2005, 22 and 34% of passenger car and motorcycle fatalities, respectively, involved speeding; the economic cost of speeding-related crashes is estimated to be $40.4 billion each year.166 Studies introduced in Refs. 171 and 172 have shown that, in certain settings, photo enforcement of speed has led to an average reduction of speed leading to 21 and 14% reduction in accidents involving severe collision and injuries, respectively. On the other hand, there are also studies investigating the negative impact of photo enforcement, including privacy, validity, intention (e.g., camera enforcement may be perceived as a revenue generator rather than for the good of the public), etc. This is, however, beyond the scope of this paper. Vehicle speed estimation is among the key traffic measurements required in an ITS. It is relevant to traffic flow, accident prediction, incident detection, etc. Common methods for speed measurement in transportation include use of inductive loops, radar, lidar, and, more recently, video cameras. There are several advantages that a vision system can provide over the use of inductive loops or radar/lidar, while presenting new challenges that need to be addressed. Conceptually, it is fairly simple for a vision system to provide some measure of speed of an object once the object of interest is properly detected, identified, and tracked. The issue is the accuracy and precision of the measurement. Although there exists a significant body of research on applying computer vision technologies to traffic and traffic flow measurements, only a very small fraction of published research evaluates accuracy and precision of speed measurement of an individual vehicle, which is critical for speed enforcement applications. A first requirement of a computer vision–based speed measurement system is good performance of the vehicle detection and tracking methods. Additionally, such a system requires (1) an accurate camera calibration strategy that produces a geometric mapping for translating image pixel positions to real-world coordinates,176–184 (2) an understanding of the impact of vehicle height on speed accuracy,179,184,185 and (3) an accurate reference measurement system.186 The geometric mapping is typically performed using a projective matrix transformation. Consider the work presented in Ref. 183 as one that introduces both the approach and potential pitfalls associated with manual calibration methods. In this paper, the calibration is achieved by manually placing marks 10 m apart on the roadway, identifying image pixel locations that contain the marks, and then using the pixel location and mark location data to construct the camera calibration mapping. A couple of issues can arise with this approach. One consideration is that manually placing easily identified marks on the road may be impractical or costly, especially in high traffic areas. Second, both the placement and the identification of the location of the marks on the road need to be quite accurate. A systematic 10 cm combined error in the mark placement and pixel location for a 10-m spacing between marks would translate to a 1% bias error in subsequent speed measurements. Finally, the camera may move or change field of view over time (intentionally or unintentionally). Hence, camera recalibration may be needed periodically. Although model-based camera calibration techniques187 have been known for a long time, it is difficult to apply these generic methods to roadside settings.176 Next, we review a few example model-based calibration methods from the perspective of impact on various aspects of speed measurement, including accuracy. First, we discuss traffic flow vision applications, where the goal is measurement of average speed and vehicle counting rather than law enforcement. We refer interested readers to Ref. 176, where a thorough discussion and analysis of camera geometric mapping calibration methods for traffic monitoring are presented. The approaches taken by Refs. 177 to 182 focus on the use of vanishing points and/or heuristic knowledge for deriving the projective matrix transform. The vanishing point(s) are identified directly from the scene. Hence, they can be automatically updated as the scene changes, for example, after pan, zoom, or tilt operations. Furthermore, scene changes can be detected by analyzing the motion activity within the scene,178 which makes the calibration steps fully automated and dynamic. This process may involve a learning stage, which would require that the scene changes are gradual. More specifically, in Ref. 177, the heuristic knowledge used includes a scale factor that varies linearly as a function of the traveling direction, which reduces the problem to a single dimension with known vehicle length distributions. The use of a known vehicle length distribution yields reasonable accuracy for average speeds duration of 20-s intervals (4% difference from inductive loop methods); however, the accuracy of individual vehicle speed estimates is quite poor. It is noted by Ref. 177 that the effect of shadows on centroid tracking is the main contributor for inaccuracies . In Ref. 179, lane boundaries and then vanishing points are detected using the motion activity map. The histogram of average speed to across 20-s intervals shows a bias of 4 to 8 mph compared to inductive loop measurements. Note that unlike Ref. 177, where blob centroids are used for speed estimation, the lowest edge of the vehicle blob is used for speed calculation in Ref. 179. In Ref. 180, camera calibration is achieved by a two-step process: a technique to remove perspective effects and a correlation technique to establish the necessary scale factor. The perspective is derived by detecting highway boundaries in the image and assuming the highway is straight. The scale factor is determined by detecting the painted strips on the highway and assuming that the length is known and constant. Accuracy results are not reported. Law enforcement is primarily concerned with the speed of individual vehicles, and here accuracy of the measurement becomes a critical concern. Accuracy requirements can be as tight as or . In Ref. 181, vanishing points and the assumption that the mean vehicle width is 14 feet are used to construct a camera calibration and resulting projective matrix transform. The reported inaccuracy of the estimated speed of an individual vehicle is , a figure somewhat below that achieved when lane boundaries are used for camera calibration.179 Note that the improvement in speed estimation accuracy may not necessarily be due to differences in the calibration procedure; instead, it may be due to the use of a vehicle tracking method that is insensitive to shadows. In Ref. 182, the vanishing point is first detected from the road edges of the scene. The camera calibration mapping is then derived in a manner similar to methods discussed earlier. The reported inaccuracy of the average speed of three test vehicles with 10 runs each is 4%. In Refs. 183 to 185 and 188, the camera calibrations are all performed based on the known real-world coordinates of some form of landmarks (manually placed or available from the scene). The reported inaccuracy of the speed estimates for individual vehicles ranges from , , to for five tested cars with speeds ranging from 13 to . Consider an accuracy issue related to the height of a vehicle image feature being tracked and the dimensionality of the image acquisition scenario. As shown in Fig. 14, a camera views a vehicle from an angle, and a tracking algorithm tracks one or more features in the acquired vehicle image. Speed on the road surface is the desired measure, while the feature being tracked (e.g., edges, blob centroid, etc.) is generally above the road at an unknown height. It is usually not possible to determine the height of the feature being tracked because a single camera image is a 2-D representation of a 3-D phenomenon, which introduces mapping ambiguities. The calibration of 2-D pixel locations to road locations assumes a given feature height, such as the road surface. Speed measurement based on tracked features at other heights will be inaccurate due to the discrepancy between assumed and real feature heights. The issue is less severe given that it is known that the vehicle travels on the road surface, and that vehicle speeds are calculated based on features that are the lowest edges or points of a motion blob (closest to the ground plane)179,184,185 rather than the centroids of a motion blob. Fig. 14Illustration of an accuracy issue related to tracked vehicle image feature height and the dimensionality of image acquisition.  The height of the tracked feature can be estimated through stereo imaging, which solves the dimensionality problem. While commercially available stereo cameras are becoming available for photo enforcement, very little scientific literature has appeared on the accuracy of this approach. One example is Ref. 189, where particle filtering is used for stereo object tracking. This method incorporates both 3-D and 2-D information into the filtering state so that the 3-D correspondence is utilized for generating each particle, and the projection errors are modeled. Additionally, it extracts environmental constraints from the video and integrates them into the dynamics model, thereby reducing both the dimensionality and uncertainty of the system dynamics and thus improving the accuracy of speed measurement. Based on results on both synthetic and realistic video sequences, this approach shows excellent accuracy with errors smaller than across all trials. Finally, a typical accuracy requirement for speed enforcement systems can be as tight as or . It is thus necessary to have an accurate reference measurement system that is at least an order of magnitude more accurate and precise. An example of research on this topic is found in Ref. 186. In summary, although individual vehicle speed is a straightforward output from most computer vision systems, there is an accuracy gap for single-camera systems. While stereo cameras192,193 for photo enforcement are becoming widely available, there are very few scientific publications on calibration and practical accuracy of 3-D systems. There are also potential issues with a lack of accurate reference measurements. In addition to 3-D solutions, another common approach to photo enforcement of speed has been through use of radar/lidar for speed and a camera for vehicle identification and evidence recording.194 4.2.2.Enforcement at road intersectionsCamera-based law enforcement at road intersections195 includes detection of red-light violations, illegal turns, and “blocking the box” incidents.196 Among these, most attention has been focused on detecting red-light violations due to their strong correlation with accidents. Most common red light camera systems197,198 operate under the principle whereby the camera is triggered by an event issued by a reasoning algorithm having access to the signals from the traffic light control system and the ILD at the stop line. The role of the camera is mainly one of evidence gathering and vehicle identification; thus the computer vision technologies involved are mainly in the area of LPR. In 2001, Ref. 199 proposed a fully vision-based method, where the state of the traffic light is automatically detected and tracked via image and video processing algorithms, and vehicle detection at a virtual stop zone is used to determine red-light violations. This removes the need of an ILD and the communication needed in other common methods. In Ref. 200, a similar goal is achieved with different computer vision techniques, which involve vehicle detection at predefined regions followed by thresholding of the speed of the detected vehicle. There is, however, no discussion about how the traffic light states are determined in this work. Given that computer vision technologies such as vehicle detection, vehicle tracking, vehicle trajectory analysis, anomaly detection, etc., have been developed, we expect to see the deployment of additional law enforcement applications such as detection of illegal turns, “blocking the box” incidents, and jay walking. Unlike speed enforcement, where a numerical output of an estimated vehicle speed with a certain absolute accuracy is required, the output for this set of applications is binary: either a violation or not a violation is detected to have occurred. In this case, the performance of the system can be assessed by a confusion matrix. In practice, a human in the loop is often required. As a result, the system would be configured to be biased toward allowing more false positives, which would eventually get ruled out by a human operator. 4.2.3.Mobile enforcementAnother interesting set of applications involves cameras mounted on a mobile platform, such as a police car, a parking enforcement vehicle, or a school bus, in contrast to cameras mounted on fixed locations (e.g., a utility pole). Depending on the application, different mobile platforms (and corresponding computer vision techniques) are needed. Many of the technologies developed for fixed cameras are applicable here. Camera mobility offers advantages such as flexibility and better coverage of sites at a lower cost, while new challenges may arise due to the typically unknown camera motion patterns. The mobile platform on which the camera is mounted may also impose limitations and constraints on the camera field of view relative to the fixed camera scenario. For example, the height of a camera mounted on a police car is typically lower than that of a camera mounted on a pole. While these constraints may not necessarily be impediments, they do call for different sets of problems to be solved. As an example of mobile enforcement, a camera mounted on a police car is typically used for the task of vehicle identification (with vehicle owner identification as a possible additional output), which may require the use of LPR technologies as discussed in Secs. 3 and 4. Another possible application is parking enforcement, as addressed by the commercial product autoChalk™,201 which tracks parking space usage via a combination of LPR technologies for unique vehicle identification (in cases where the license plate is not occluded) and image processing technologies for vehicle signature matching. Since signature matching through images without a license plate cannot uniquely identify a vehicle, additional information such as location, time, human verification, etc., may be used. Yet another example is the use of cameras for school-bus stop enforcement as addressed by the CrossingGuard® School Bus Stop Arm Violation Enforcement System. CrossingGuard® records videos of potential violations and provides an enforcement process that requires a human to verify the occurrence of the violation. Computer vision techniques such as motion/object detection can be used to fully automate the process in the future. In summary, mobile solutions offer greater flexibility and wider coverage at a lower cost. Many of the techniques developed for stationary solutions can be applied to mobile platforms provided the additional challenges introduced by unknown motion patterns in the imaging and a different set of limitations in the camera field of view can be resolved. In addition to these examples, new applications are being rapidly developed due to the richness of information acquired with video cameras compared to other (e.g., magnetic and ultrasonic) roadway sensors. For example, parking law enforcement applications are being built into parking occupancy detection camera systems.202,203 Reference 203 describes the use of computer vision for the detection of parking in exclusion zones, short-term parking violations, and parking boundary violations. 5.Trends and ChallengesThe need for improvement in safety, security, and efficiency of transportation infrastructure continues to attract a tremendous amount of innovation and change. In this paper, we have surveyed the current advances in computer vision related to transportation systems. We believe the following trends to be the key influencers in major innovation in the application of computer vision in transportation:
There are two major challenges in the successful adoption of computer vision in solving these transportation problems. Many algorithms today report high performance only in certain restrictive scenarios and do not generalize well to realistic conditions. The first challenge therefore is in developing algorithms that exhibit high accuracy and reliability across a wide variety of environmental factors, including weather, illumination, capture geometry, traffic behavior, etc. The second challenge is in implementing these algorithms within the available infrastructure in a cost-efficient manner. To go from computer vision and imaging to visual intelligence within the vehicles and infrastructure will require a relentless attention to driving down the cost of available technology. The computing power available today within the transportation network and within the vehicles is not always sufficient to execute existing algorithms with acceptable speed; hence, more efficient and powerful platforms are needed for wider adoption of some of the advancements discussed above. Indeed Moore’s law and associated hardware advances will over time enable increasingly sophisticated algorithms to execute with acceptable computational time, memory, and storage. Implementation on advanced computing platforms such as multicore processors and graphics processing units will also be an active area of exploration. AcknowledgmentsThe authors thank Natesh Manikoth of the Federal Aviation Administration for his insights and many valuable conversations. References
“New estimates of benefits of crash avoidance features on passenger vehicles,”
(2010). Google Scholar
I-Car Advantage, “Lane departure warning systems,”
http://www.i-car.com/html_pages/technical_information/advantage/advantage_online_archives/2005/090605.shtml Google Scholar
C. Visvikiset al.,
“Study of lane departure warning and lane change assistant systems,”
(2008). Google Scholar
D. O. Cualainet al.,
“Automotive standards-grade lane departure warning system,”
IET Intell. Transp. Syst., 6
(1), 44
–57
(2012). http://dx.doi.org/10.1049/iet-its.2010.0043 1751-956X Google Scholar
“BMW lane departure warning system overview,”
http://bmwcoders.com/forum/instructions-user-manuals-6/bmw-lane-departure-warning-system-298/ Google Scholar
G. Carioet al.,
“Data fusion algorithms for lane departure warning systems,”
in American Control Conference (ACC), 2010,
5344
–5349
(2010). Google Scholar
S. K. Kenue,
“Lanelok: detection of lane boundaries and vehicle tracking using image-processing techniques-Parts I and II,”
Proc. SPIE, 1195 221
–245
(1989). http://dx.doi.org/10.1117/12.969887 PSISDG 0277-786X Google Scholar
Y. WangD. ShenE. K. Teoh,
“Lane detection using spline model,”
Pattern Recognit. Lett., 21
(8), 677
–689
(2000). http://dx.doi.org/10.1016/S0167-8655(00)00021-0 PRLEDG 0167-8655 Google Scholar
Y. WangE. K. TeohD. Shen,
“Lane detection and tracking using B-Snake,”
Image Vis. Comput., 22
(4), 269
–280
(2004). http://dx.doi.org/10.1016/j.imavis.2003.10.003 IVCODK 0262-8856 Google Scholar
T. Liuet al.,
“A novel approach of road recognition based in deformable template and genetic algorithm,”
in Proc. Intelligent Transportation System Conf.,
1251
–1256
(2003). Google Scholar
K. Kluge,
“Extracting road curvature and orientation from image edge points without perceptual grouping into features,”
in Proc. of IEEE Intelligent Vehicles’94 Symp.,
109
–114
(1994). Google Scholar
K. KlugeS. Lakshmanan,
“A deformable-template approach to lane detection,”
in Proc. of the Intelligent Vehicles Symp.’95,
54
–59
(1995). Google Scholar
Q. LiN. ZhengH. Cheng,
“Springrobot: a prototype autonomous vehicle and its algorithms for lane detection,”
IEEE Trans. Intell. Transp. Syst., 5
(4), 300
–308
(2004). http://dx.doi.org/10.1109/TITS.2004.838220 1524-9050 Google Scholar
E. DickmannsB. Mysliwetz,
“Recursive 3D road and relative ego–state recognition,”
IEEE Trans. Pattern Anal. Mach. Intell., 14
(2), 199
–213
(1992). http://dx.doi.org/10.1109/34.121789 ITPIDJ 0162-8828 Google Scholar
A. Guiducci,
“Parametric model of the perspective projection of a road with applications to lane Kkeeping and 3D road reconstruction,”
Comput. Vis. Image Underst., 73
(3), 414
–427
(1999). http://dx.doi.org/10.1006/cviu.1998.0737 CVIUF4 1077-3142 Google Scholar
M. Perez,
“Vision-based pedestrian detection for driving assistance,”
(2005) http://users.ece.utexas.edu/~bevans/courses/ee381k/projects/spring05/perez/LitSurveyReport.pdf October 2013). Google Scholar
M. Bertozziet al.,
“Shape-based pedestrian detection,”
in Proc. IEEE Intelligent Vehicles Symp. 2000,
215
–220
(2000). Google Scholar
C. Curioet al.,
“Walking pedestrian recognition,”
IEEE Trans. Intell. Transp. Syst., 1
(3), 155
–163
(2000). http://dx.doi.org/10.1109/6979.892152 1524-9050 Google Scholar
M. Orenet al.,
“Pedestrian detection using wavelet templates,”
in Proc. IEEE Conf. on Computer Vision and Pattern Recognition,
193
–199
(1997). Google Scholar
L. ZhaoC. Thorpe,
“Stereo- and neural network-based pedestrian detection,”
in Proc. IEEE Int. Conf. on Intelligent Transportation Systems’99,
298
–303
(1999). Google Scholar
R. PolanaR. Nelson,
“Low level recognition of human motion (or how to get your man without finding his body parts),”
in IEEE Computer Society Workshop on Motion of Nonrigid and Articulate Objects,
(1994). Google Scholar
B. HeiseleC. W¨ohler,
“Motion-based recognition of pedestrians,”
in Proc. IEEE Int. Conf. on Pattern Recognition,
1325
–1330
(1998). Google Scholar
M. Bertozziet al.,
“Stereo vision-based approaches for pedestrian detection,”
in IEEE Conf. on Computer Vision and Pattern Recognition—Workshops,
(2005). Google Scholar
D. G. Lowe,
“Distinctive image features from scale-invariant keypoints,”
Int. J. Comput. Vis., 60
(2), 91
–110
(2004). http://dx.doi.org/10.1023/B:VISI.0000029664.99615.94 IJCVEQ 0920-5691 Google Scholar
N. DalalB. Triggs,
“Histograms of oriented gradients for human detection,”
in IEEE Computer Society Conf. on Computer Vision and Pattern Recognition,
886
–893
(2005). Google Scholar
T. OjalaM. PietikäinenD. Harwood,
“Performance evaluation of texture measures with classification based on Kullback discrimination of distributions,”
in Proc. of the 12th IAPR Int. Conf. on Pattern Recognition,
582
–585
(1994). Google Scholar
J. Mataset al.,
“Robust wide baseline stereo from maximally stable extremal regions,”
in Proc. of British Machine Vision Conf.,
384
–396
(2002). Google Scholar
P. Felzenszwalbet al.,
“Object detection with discriminatively trained part based models,”
IEEE Trans. Pattern Anal. Mach. Intell., 32
(9), 1627
–1645
(2010). http://dx.doi.org/10.1109/TPAMI.2009.167 ITPIDJ 0162-8828 Google Scholar
Y. DingJ. Xiao,
“Contextual boost for pedestrian detection,”
in IEEE Computer Society Conf. on Computer Vision and Pattern Recognition,
2895
–2902
(2012). Google Scholar
R. Benensonet al.,
“Pedestrian detection at 100 frames per second,”
in IEEE Computer Society Conf. on Computer Vision and Pattern Recognition,
2903
–2910
(2012). Google Scholar
R. BenensonR. TimofteG. L. Van,
“Stixels estimation without depth-map computation,”
in IEEE Int. Conf. on Computer Vision Workshops,
2010
–2017
(2011). Google Scholar
P. Dollaret al.,
“Pedestrian detection: an evaluation of the state of the art,”
IEEE Trans. Pattern Anal. Mach. Intell., 34
(4), 761
–743
(2012). http://dx.doi.org/10.1109/TPAMI.2011.155 ITPIDJ 0162-8828 Google Scholar
M. Bertozziet al.,
“IR pedestrian detection for advanced driver assistance systems,”
in Proc. DAGM-Symp.,
582
–590
(2003). Google Scholar
T. L. SullivanT. A. Messmer,
“Perceptions of deer-vehicle collision management by state wildlife agency and department of transportation administrators,”
Wildl. Soc. Bull., 31
(1), 163
–173
(2003). WLSBA6 0091-7648 Google Scholar
P. Händelet al.,
“Far infrared camera platform and experiments for moose early warning,”
Trans. Soc. Automot. Eng. Jpn. , 40
(4), 1095
–1099
(2008). Google Scholar
M. S. ZahraniK. RagabA. Ul Haque,
“Design of GPS-based system to avoid camel-vehicle collisions: a review,”
Asian J. Appl. Sci., 4
(4), 362
–377
(2011). http://dx.doi.org/10.3923/ajaps.2011.362.377 AJASGN 1996-3343 Google Scholar
D. NoyceA. GajendranandR. Dharmaraju,
“Development of a bicycle and pedestrian detection and classification algorithm for active-infrared overhead vehicle imaging sensors,”
in 85th Annual Meeting of the Transportation Research Board,
(2006). Google Scholar
“Blueprint for ending distracted driving,”
(2012) www.distraction.gov June 2013). Google Scholar
“Overview of the National Highway Traffic Safety Administration’s Driver Distraction Program,”
(2010) www.distraction.gov June 2013). Google Scholar
C. W. Youet al.,
“CarSafe app: alerting drowsy and distracted drivers using dual cameras on smartphones,”
in Proc. 11th Annual Int. Conf. on Mobile Systems, Applications, and Services,
461
–462
(2013). Google Scholar
B. BhowmickK. S. Kumar,
“Detection and classification of eye state in IR camera for driver drowsiness identification,”
in Proc. 2009 IEEE Conf. on Signal and Image Processing Algorithms,
340
–345
(2009). Google Scholar
E. Murphy-Chutorianet al.,
“Head pose estimation for driver assistance systems: a robust algorithm and experimental evaluation,”
in Proc. IEEE Intelligent Transportation Systems Conf.,
709
–714
(2007). Google Scholar
D. HansenQ. Ji,
“In the eye of the beholder: a survey of models for eyes and gaze,”
IEEE Trans. Pattern Anal. Mach. Intell., 32
(3), 478
–500
(2010). http://dx.doi.org/10.1109/TPAMI.2009.30 ITPIDJ 0162-8828 Google Scholar
H. Erenet al.,
“Estimating driver behavior by a smartphone,”
in Proc. 2012 Intelligent Vehicles Symp.,
234
–239
(2012). Google Scholar
B. LeeW. Chung,
“Driver alertness monitoring using fusion of facial features and bio-signals,”
IEEE Sens. J., 12
(7), 2416
–2422
(2012). http://dx.doi.org/10.1109/JSEN.2012.2190505 ISJEAZ 1530-437X Google Scholar
H. S. Shinet al.,
“Real time car driver’s condition monitoring system,”
in Proc. IEEE Sensors,
951
–954
(2010). Google Scholar
P. Bouchneret al.,
“Fatigue of car drivers—detection and classification based on experiments on car simulators,”
in Proc. 6th Int. Conf. Simulation, Modelling, and Optimization,
727
–732
(2006). Google Scholar
K. Saneyoshi,
“Drive assist system using stereo image recognition,”
in Proc. of the Intelligent Vehicles Symp.,
230
–235
(1996). Google Scholar
B. KhanalS. AliD. Sidibé,
“Robust road sign segmentation in color images,”
in Proc. Int. Conf. on Computer Vision Theory and Applications,
307
–310
(2012). Google Scholar
S. Escaleraet al.,
“Background on traffic sign detection and recognition,”
SpringerBriefs Comput. Sci., 5
–13 Springer(2011). Google Scholar
M. BenallalJ. Meunier,
“Real-time color segmentation of road signs,”
in IEEE Canadian Conf. on Electrical and Computer Engineering,
1823
–1826
(2003). Google Scholar
S. Varunet al.,
“A road traffic signal recognition system based on template matching employing tree classifier,”
in Proc. of the Int. Conf. on Computational Intelligence and Multimedia Applications,
360
–365
(2007). Google Scholar
W. KuoC. Lin,
“Two-stage road sign detection and recognition,”
in IEEE Int. Conference on Multimedia and Expo,
1427
–1430
(2007). Google Scholar
A. Broggiet al.,
“Real time road signs recognition,”
in IEEE Intelligent Vehicles Symp.,
981
–986
(2007). Google Scholar
A. RutaY. LiX. Liu,
“Detection, tracking and recognition of traffic signs from video input,”
in Int. IEEE Conf. on Intelligent Transportation Systems,
55
–60
(2008). Google Scholar
A. EscaleraJ. ArmingolM. Mata,
“Traffic sign recognition and analysis for intelligent vehicles,”
Image Vis. Comput., 21
(3), 247
–258
(2003). http://dx.doi.org/10.1016/S0262-8856(02)00156-7 IVCODK 0262-8856 Google Scholar
X. Gaoet al.,
“Recognition of traffic signs based on their colour and shape features extracted using human vision models,”
J. Vis. Commun. Image Represent., 17
(4), 675
–685
(2006). http://dx.doi.org/10.1016/j.jvcir.2005.10.003 JVCRE7 1047-3203 Google Scholar
Y. Y. NguwiA. Z. Kouzani,
“Detection and classification of road signs in natural environments,”
Neural Comput. Appl., 17
(3), 265
–289
(2008). http://dx.doi.org/10.1007/s00521-007-0120-z 0941-0643 Google Scholar
C. Y. Fanget al.,
“An automatic road sign recognition system based on a computational model of human recognition processing,”
Comput. Vis. Image Underst., 96
(2), 237
–268
(2004). http://dx.doi.org/10.1016/j.cviu.2004.02.007 CVIUF4 1077-3142 Google Scholar
H. Gómezet al.,
“Goal evaluation of segmentation for traffic sign recognition,”
IEEE Trans. Intell. Transp. Syst., 11
(4), 917
–930
(2010). http://dx.doi.org/10.1109/TITS.2010.2054084 1524-9050 Google Scholar
G. Loy,
“Fast shape-based road sign detection for a driver assistance system,”
in IEEE/RSJ Int. Conf. on Intelligent Robots and Systems,
70
–75
(2004). Google Scholar
C. PauloP. Correia,
“Automatic detection and classification of traffic signs,”
in Eighth Int. Workshop on Image Analysis for Multimedia Interactive Services,
(2007). Google Scholar
B. Cyganek,
“Circular road signs recognition with soft classifiers,”
Integrated Comput.-Aided Eng., 14
(4), 323
–343
(2007). CCAEDJ 0733-3536 Google Scholar
K. Brkicet al.,
“Generative modeling of spatio-temporal traffic sign trajectories,”
in Computer Vision and Pattern Recognition Workshop 2010,
(2010). Google Scholar
G. Piccioliet al.,
“Robust method for road sign detection and recognition,”
Image Vis. Comput., 14
(3), 209
–223
(1996). http://dx.doi.org/10.1016/0262-8856(95)01057-2 IVCODK 0262-8856 Google Scholar
P. PaclikJ. NovovicovaR. Duin,
“Building road-sign classifiers using a trainable similarity measure,”
IEEE Trans. Intell. Transp. Syst., 7
(3), 309
–321
(2006). http://dx.doi.org/10.1109/TITS.2006.880627 1524-9050 Google Scholar
A. RutaY. LiX. Liu,
“Real-time traffic sign recognition from video by class-specific discriminative features,”
Pattern Recognit., 43 416
–430
(2010). http://dx.doi.org/10.1016/j.patcog.2009.05.018 PTNRA8 0031-3203 Google Scholar
S. H. HsuC. L. Huang,
“Road sign detection and recognition using matching pursuit method,”
Image Vis. Comput., 19
(3), 119
–129
(2001). http://dx.doi.org/10.1016/S0262-8856(00)00050-0 IVCODK 0262-8856 Google Scholar
M. PrietoA. Allen,
“Using self-organizing maps in the detection and recognition of road signs,”
Image Vis. Comput., 27
(6), 673
–683
(2009). http://dx.doi.org/10.1016/j.imavis.2008.07.006 IVCODK 0262-8856 Google Scholar
C. Bahlmannet al.,
“A system for traffic sign detection, tracking, and recognition using color, shape, and motion information,”
in IEEE Intelligent Vehicles Symp.,
255
–260
(2004). Google Scholar
(2007). Google Scholar
M. KutilaM. Jokela,
“Road condition monitoring,”
in ASSET-Road Conference & Workshop,
(2009). Google Scholar
FLIR, “FLIR thermal imaging cameras help determine road conditions in Finland,”
(2013) http://support.flir.com/appstories/AppStories/Automation/Roadscanner_EN.pdf://support.flir.com/appstories/AppStories/Automation/Roadscanner_EN.pdf October ). 2013). Google Scholar
R. KovordányiT. AlmK. Ohlsson,
“Night-vision display unlit during uneventful periods may improve traffic safety,”
in IEEE Intelligent Vehicles Symp.,
282
–287
(2006). Google Scholar
“Safety trends in automotive electronics,”
(2013) http://www.tcenviroshield.com/userfiles/file/collateral/Safety_trends_automotive_electronics.pdf October ). 2013). Google Scholar
O. Cualainet al.,
“Trends towards automotive electronic vision systems for mitigation of accidents in safety critical situations,”
New Trends and Developments in Automotive System Engineering, 493
–512 InTech Europe,
(2011). Google Scholar
Mobileye, “Mobileye: adaptive headlight control,”
(2008) http://www.mobileye-vision.com/ October 2013). Google Scholar
EricoGuizzo, “How Google's Self-Driving Car Works,”
(2013) http://spectrum.ieee.org/automaton/robotics/artificial-intelligence/how-google-self-driving-car-works October ). 2013). Google Scholar
V. KastrinakiM. ZervakisK. Kalaitzakis,
“A survey of video processing techniques for traffic applications,”
Image Vis. Comput., 21
(4), 359
–381
(2003). http://dx.doi.org/10.1016/S0262-8856(03)00004-0 IVCODK 0262-8856 Google Scholar
S. Takabaet al.,
“Measurement of traffic flow using real time processing of moving pictures,”
in Proc. 32nd IEEE Vehicular Technology Conf.,
488
–494
(1982). Google Scholar
N. Hashimoto,
“Development of an image processing traffic flow measurement system,”
Sumitomo Electr. Tech. Rev., 25 133
–138
(1990). Google Scholar
K. DickinsonR. Waterfall,
“Image processing applied to traffic: a general review,”
Traffic Eng. Contr., 25
(1), 6
–13
(1984). TENCA4 Google Scholar
K. DickinsonC. Wan,
“Road traffic monitoring using the TRIP II system,”
in Proc. 2nd Int. Conf. on Road Traffic Monitoring,
56
–60
(1989). Google Scholar
R. Ashworthet al.,
“Applications of video image processing for traffic control,”
in 2nd Int. Conf. on Road Traffic Control,
119
–122
(1985). Google Scholar
R. Inigo,
“Traffic monitoring and control using machine vision: a survey,”
IEEE Trans. Ind. Electron., IE-32
(3), 177
–185
(1985). http://dx.doi.org/10.1109/TIE.1985.350155 ITIED6 0278-0046 Google Scholar
R. Inigo,
“Application of machine vision to traffic monitoring and control,”
IEEE Trans. Veh. Technol., 38
(3), 112
–122
(1989). http://dx.doi.org/10.1109/25.45464 ITUTAB 0018-9545 Google Scholar
N. Hoose, Computer Image Processing in Traffic Engineering, Research Studies Press, Taunton, UK
(1991). Google Scholar
N. Hoose,
“IMPACT: an image analysis tool for motorway analysis surveillance,”
Traffic Eng. Contr., 33
(3), 140
–147
(1992). TENCA4 Google Scholar
J. VersavelF. LemaireD. Van der Stede,
“Camera and computer-aided traffic sensor,”
in Proc. 2nd Int. Conf. on Road Traffic Monitoring,
66
–70
(1989). Google Scholar
A. AliE. Dagless,
“Computer vision for automatic road traffic analysis,”
in Int. Conf. on Automation, Robotics and Computer Vision,
875
–879
(1990). Google Scholar
A. AliE. Dagless,
“Computer vision-aided road traffic monitoring,”
in 24th Int. Conf. on Road Transport Informatics and Intelligent Vehicle-Highway Systems,
55
–61
(1991). Google Scholar
A. AliE. Dagless,
“A parallel processing model for real-time computer vision-aided road traffic monitoring,”
Parallel Process. Lett., 2
(2), 257
–264
(1992). http://dx.doi.org/10.1142/S0129626492000398 PPLTEE 0129-6264 Google Scholar
A. AliJ. Bulas-CruzE. Dagless,
“Vision based road traffic data collection,”
in Proc. ISATA 26th Int. Conf.,
609
–616
(1993). Google Scholar
T. Abramczuk,
“A microcomputer based TV detector for road traffic,”
in Symp. on Road Research Program,
(1984). Google Scholar
M. FathyM. Siyal,
“A real-time image processing approach to measure traffic queue parameters,”
IEEE Proc. Vis., Image, Signal Process., 142
(5), 297
–303
(1995). http://dx.doi.org/10.1049/ip-vis:19952064 IVIPEK 1350-245X Google Scholar
M. FathyM. Siyal,
“An image detection technique based on morphological edge detection and background differencing for real-time traffic analysis,”
Pattern Recognit. Lett., 16
(12), 1321
–1330
(1995). http://dx.doi.org/10.1016/0167-8655(95)00081-X PRLEDG 0167-8655 Google Scholar
M. FathyM. Siyal,
“Measuring traffic movements at junctions using image processing techniques,”
Pattern Recognit. Lett., 18
(5), 493
–500
(1997). http://dx.doi.org/10.1016/S0167-8655(97)00026-3 PRLEDG 0167-8655 Google Scholar
D. KollerJ. WeberJ. Malik,
“Robust multiple car tracking with occlusion reasoning,”
Lec. Notes Comput. Sci., 800 189
–196
(1994). http://dx.doi.org/10.1007/3-540-57956-7 LNCSD9 0302-9743 Google Scholar
D. Kolleret al.,
“Towards robust automatic traffic scene analysis in real-time,”
in Int. Conf. on Pattern Recognition,
126
–131
(1994). Google Scholar
D. KollerJ. WeberJ. Malik,
“Towards real-time visual based tracking in cluttered traffic scenes,”
in Intelligent Vehicles Symp.,
201
–206
(1994). Google Scholar
P. Michalopoulos,
“Vehicle detection through image processing: the autoscope system,”
IEEE Trans. Veh. Technol., 40
(1), 21
–29
(1991). http://dx.doi.org/10.1109/25.69968 ITUTAB 0018-9545 Google Scholar
B. Carlson,
“Autoscope clearing the congestion: vision makes traffic control intelligent,”
Adv. Imaging, 12
(2), 54
–56
(1997). ADIMEZ 1042-0711 Google Scholar
M. YuG. JiangY. Bokang,
“An integrative method for video based traffic parameter extraction in ITS,”
in IEEE Asia Pacific Conf. on Circuits and Systems,
136
–139
(2000). Google Scholar
B. Abreuet al.,
“Video-based multi-agent traffic surveillance system,”
in Proc. IEEE Intelligent Vehicles Symp.,
457
–462
(2000). Google Scholar
C. SetchellE. Dagless,
“Vision-based road-traffic monitoring sensor,”
in IEE Proc. Vision, Image and Signal Processing,
78
–84
(2001). Google Scholar
R. Woesler,
“Fast extraction of traffic parameters and re-identification of vehicles from video data,”
in Proc. Intelligent Transportation Systems,
774
–778
(2002). Google Scholar
M. Brambergeret al.,
“Real-time video analysis on an embedded smart camera for traffic surveillance,”
in IEEE Proc of the 10th IEEE Real-Time and Embedded Technology and Applications Symp.,
174
–181
(2004). Google Scholar
M. SiyalB. ChoudharyA. Rajput,
“An image processing based approach for real time road traffic applications,”
in Poc. 9th Int. Multitopic Conf.,
1
–4
(2005). Google Scholar
E. BaşM. TekalpS. Salman,
“Automatic vehicle counting from video for traffic flow analysis,”
in Proc. 2007 IEEE Intelligent Vehicles Symp.,
392
–397
(2007). Google Scholar
T. H. ChenY. LinT. Y. Chen,
“Intelligent vehicle counting method based on blob analysis in traffic surveillance,”
in Second Int. Conf. on Innovative Computing, Information and Control,
238
–242
(2007). Google Scholar
E. Ince,
“Measuring traffic flow and classifying vehicle types: a surveillance video based approach,”
Turk. J. Electr. Eng. Comput. Sci., 19
(4), 607
(2011). 1300-0632 Google Scholar
O. BulanE. BernalR. Loce,
“Efficient processing of transportation surveillance videos in the compressed domain,”
J. Electron. Imaging, 22
(4), 041116
(2013). http://dx.doi.org/10.1117/1.JEI.22.4.041116 JEIME5 1017-9909 Google Scholar
K. OzbayP. Kachroo, Incident Management in Intelligent Transportation Systems, Artech House, Boston, MA
(1999). Google Scholar
H. Ikedaet al.,
“Abnormal incident detection system employing image processing technology,”
in Int. Conf. on Intelligent Transportation Systems,
748
–752
(1999). Google Scholar
J. Versavel,
“Road safety through video detection,”
in Int. Conf. on Intelligent Transportation Systems,
753
–757
(1999). Google Scholar
H. Yamamotoet al.,
“In-tunnel traffic monitor support system with image processing technique,”
in IEEE Conf. on Road and Traffic,
51
–58
(1992). Google Scholar
M. KimachiK. KanayamaK. Teramoto,
“Incident prediction by fuzzy image sequence analysis,”
in Proc. of the IEEE Int. Conf. on Vehicle Navigation and Information Systems,
51
–57
(1994). Google Scholar
X. ZhangF. BuschJ. M. Blosseville,
“Guidelines for implementation of automatic incident detection systems,”
(1995). Google Scholar
J. Zifeng,
“Macro and micro freeway automatic incident detection (AID) methods based on image processing,”
in Conf. on Intelligent Transportation Systems,
344
–349
(1997). Google Scholar
M. TrivediI. MikiéG. Kogut,
“Distributed video networks for incident detection and management,”
in Proc. Intelligent Transportation Systems,
155
–160
(2000). Google Scholar
P. Collinson,
“The application of camera based traffic monitoring systems,”
in IEE Seminar on CCTV and Road Surveillance,
8(1)
–8(6)
(1999). Google Scholar
T. WellsE. Toffin,
“Video-based automatic incident detection on San Mateo Bridge in the San Francisco Bay Area,”
in 12th World Congress on Intelligent Traffic Systems,
(2005). Google Scholar
M. Shehataet al.,
“Video-based automatic incident detection for smart roads: the outdoor environmental challenges regarding false alarms,”
IEEE Trans. Intell. Transp. Syst., 9
(2), 349
–360
(2008). http://dx.doi.org/10.1109/TITS.2008.915644 1524-9050 Google Scholar
S. Sadeket al.,
“A statistical framework for real-time traffic accident recognition,”
J. Signal Inform. Process., 1
(1), 77
–81
(2010). http://dx.doi.org/10.4236/jsip.2010.11008 2159-4465 Google Scholar
M. Pucheret al.,
“Multimodal highway monitoring for robust incident detection,”
in Proc. of the 13th IEEE Int. Conf. on Intelligent Transportation Systems,
837
–842
(2010). Google Scholar
W. Vickrey, 466
–477
(1959). Google Scholar
S. Stewart,
“Electronic tolling and traffic management,”
in Proc. IEE Seminar on Electronic Tolling and Congestion Charging,
1
–14
(1999). Google Scholar
R. O’Connor,
“Toronto’s highway 407: a cashless toll road,”
in Proc. 5th World Congress on Intelligent Transport Systems,
(1998). Google Scholar
D. Ekern,
“Tolling facilities report,”
(2008). Google Scholar
T. Litman,
“London congestion pricing: implications for other cities,”
(2011). Google Scholar
J. Eliasson,
“Lessons from the Stockholm congestion charging trial,”
Transp. Policy, 15
(6), 395
–404
(2008). http://dx.doi.org/10.1016/j.tranpol.2008.12.004 TRPOE9 0967-070X Google Scholar
F. Seik,
“An advanced demand management instrument in urban transport: electronic road pricing in Singapore,”
Cities, 17
(1), 33
–45
(2000). http://dx.doi.org/10.1016/S0264-2751(99)00050-5 0264-2751 Google Scholar
S. ChryslerA. Nelson,
“Driver comprehension of managed lane signing,”
(2009). Google Scholar
M. LayK. Daley,
“The Melbourne city link project,”
Transp. Policy, 9
(3), 261
–267
(2002). http://dx.doi.org/10.1016/S0967-070X(02)00020-3 TRPOE9 0967-070X Google Scholar
R. KalauskasB. TaylorH. Iseki,
“TASK A-1: motivations behind electronic road pricing,”
Berkeley
(2009). Google Scholar
D. KalinowskaK. Steininger,
“Car road charging: impact assessment on German and Austrian households,”
DIW Berlin, German Institute for Economic Research, Berlin
(2009). Google Scholar
S. Schijns,
“Final report: automated vehicle occupancy monitoring systems,”
Mississauga, Ontario, Canada
(2004). Google Scholar
P. M. Birchet al.,
“Automated vehicle occupancy monitoring,”
Opt. Eng., 43
(8), 1828
–1832
(2004). http://dx.doi.org/10.1117/1.1766300 OPEGAR 0091-3286 Google Scholar
B. C. Richards,
“Adapting face recognition techniques to motor vehicle recognition,”
(2005) http://www.ewp.rpi.edu/hartford/~rhb/cs_seminar_2005/SessionA2/richards.pdf October 2013). Google Scholar
P. Paulet al.,
“Application of the SNoW machine learning paradigm to a set of transportation imaging problems,”
Proc. SPIE, 8305 830512
(2012). http://dx.doi.org/10.1117/12.912110 PSISDG 0277-786X Google Scholar
R. Poppe,
“A survey on vision-based human action recognition,”
Image Vis. Comput., 28
(6), 976
–990
(2010). http://dx.doi.org/10.1016/j.imavis.2009.11.014 IVCODK 0262-8856 Google Scholar
J. Candamoet al.,
“Understanding transit scenes: a survey on human behavior-recognition algorithms,”
IEEE Trans. Intell. Transp. Syst., 11
(1), 206
–224
(2010). http://dx.doi.org/10.1109/TITS.2009.2030963 1524-9050 Google Scholar
P. Turagaet al.,
“Machine recognition of human activities: a survey,”
IEEE Trans. Circuits Syst. Video Technol., 18
(11), 1473
–1488
(2008). http://dx.doi.org/10.1109/TCSVT.2008.2005594 ITCTEM 1051-8215 Google Scholar
B. T. MorrisM. M. Trivedi,
“A survey of vision-based trajectory learning and analysis for surveillance,”
IEEE Trans. Circuits Syst. Video Technol., 18
(8), 1114
–1127
(2008). http://dx.doi.org/10.1109/TCSVT.2008.927109 ITCTEM 1051-8215 Google Scholar
W. Huet al.,
“A survey on visual surveillance of object motion and behaviors,”
IEEE Trans. Syst., Man, Cybern. C, Appl. Rev., 34
(3), 334
–352
(2004). http://dx.doi.org/10.1109/TSMCC.2004.829274 ITCRFH 1094-6977 Google Scholar
N. BuchS. A. VelastinJ. Orwell,
“A review of computer vision techniques for the analysis of urban traffic,”
IEEE Trans. Intell. Transp. Syst., 12
(3), 920
–939
(2011). http://dx.doi.org/10.1109/TITS.2011.2119372 1524-9050 Google Scholar
A. YilmazO. JavedM. Shah,
“Object tracking: a survey,”
ACM Comput. Surv., 38
(4), 1
–45
(2006). http://dx.doi.org/10.1145/1177352 ACSUEY 0360-0300 Google Scholar
M. EnzweilerD. M. Gavrila,
“Monocular pedestrian detection: survey and experiments,”
IEEE Trans. Pattern Anal. Mach. Intell., 31
(12), 2179
–2195
(2009). http://dx.doi.org/10.1109/TPAMI.2008.260 ITPIDJ 0162-8828 Google Scholar
C. Liet al.,
“Abnormal behavior detection via sparse reconstruction analysis of trajectory,”
in Proc. IEEE Int. Conf. on Image and Graphics,
807
–810
(2011). Google Scholar
X. Moet al.,
“A joint sparsity model for video anomaly detection,”
in Proc. IEEE Asilomar Conf.,
1969
–1973
(2012). Google Scholar
C. PiciarelliC. MicheloniG. Foresti,
“Trajectory-based anomalous event detection,”
IEEE Trans. Circuits Syst. Video Technol., 18
(11), 1544
–1554
(2008). http://dx.doi.org/10.1109/TCSVT.2008.2005599 ITCTEM 1051-8215 Google Scholar
H. M. Atiqet al.,
“Vehicle detection and shape recognition using optical sensors: a review,”
in Second Int. Conf. on Machine Learning and Computing,
223
–227
(2010). Google Scholar
R. Garg,
“Analysis of vehicle recognition methods in traffic scenes,”
(2005) http://www.cs.washington.edu/homes/rahul/data/minip_report.pdf October 2013). Google Scholar
S. TropartzE. HorberK. Gruner,
“Experiences and results from vehicle classification using infrared overhead laser sensors at toll plazas in New York City,”
in Proc. of 1999 IEEE/IEEJ/JSAI Int. Conf. on Intelligent Transportation Systems,
686
–691
(1999). Google Scholar
D. Koller,
“Moving object recognition and classification based on recursive shape parameter estimation,”
in Proc. 12th Israeli Conf. on Artificial Intelligence, Computer Vision, and Neural Networks,
359
–368
(1993). Google Scholar
M. J. LeottaJ. L. Mundy,
“Vehicle surveillance with a generic, adaptive, 3D vehicle model,”
IEEE Trans. Pattern Anal. Mach. Intell., 33
(7), 1457
–1469
(2011). http://dx.doi.org/10.1109/TPAMI.2010.217 ITPIDJ 0162-8828 Google Scholar
A. H. S. LaiN. H. C. Yung,
“Vehicle-type identification through automated virtual loop assignment and block-based direction-biased motion estimation,”
IEEE Trans. Intell. Transp. Syst., 1
(2), 86
–97
(2000). http://dx.doi.org/10.1109/6979.880965 1524-9050 Google Scholar
O. C. Ozcanliet al.,
“Augmenting shape with appearance in vehicle category recognition,”
in IEEE Computer Society Conf. on Computer Vision and Pattern Recognition,
935
–942
(2006). Google Scholar
X. MaW. E. L. Grimson,
“Edge-based rich representation for vehicle classification,”
in Tenth IEEE Int. Conf. on Computer Vision,
1185
–1192
(2005). Google Scholar
C.-N. E. Anagnostopouloset al.,
“License plate recognition from still images and video sequences: a survey,”
IEEE Trans. Intell. Transp. Syst., 9
(3), 377
–391
(2008). http://dx.doi.org/10.1109/TITS.2008.922938 1524-9050 Google Scholar
Y. Artanet al.,
“Efficient SMQT features for SNoW-based classification on face detection and character recognition tasks,”
in Proc Western N.Y. Image Processing Conf.,
45
–48
(2012). Google Scholar
D. Keyserset al.,
“Deformation models for image recognition,”
IEEE Trans. Pattern Anal. Mach. Intell., 29
(8), 1422
–1435
(2007). http://dx.doi.org/10.1109/TPAMI.2007.1153 ITPIDJ 0162-8828 Google Scholar
J. A. Rodríguez-Serranoet al.,
“Data driven vehicle identification by image matching,”
Lec. Notes Comput. Sci., 7584 536
–545
(2012). http://dx.doi.org/10.1007/978-3-642-33868-7 LNCSD9 0302-9743 Google Scholar
R. Balaet al.,
“Image simulation for automatic license plate recognition,”
Proc. SPIE, 8305 83050Z
(2012). http://dx.doi.org/10.1117/12.912453 PSISDG 0277-786X Google Scholar
S. A. ShaheenC. J. RodierE. Cavanagh,
“Automated speed enforcement in the U.S.: a review of the literature on benefits and barriers to implementation,”
(2007). Google Scholar
“Traffic safety facts, 2005 data. Speeding,”
(2006). Google Scholar
Wikipedia, “Traffic collision,”
(2013) http://en.wikipedia.org/wiki/Traffic_collision#cite_note-usdot_>fha-17 October ). 2013). Google Scholar
J. StusterZ. CoffmanD. Warren,
“Synthesis of safety research related to speed and speed management,”
Washington, DC
(1998). Google Scholar
Vägverket, “Facts about road safety cameras: lifesavers on the road,”
(2013) http://publikationswebbutik.vv.se/upload/4550/89264_facts_about_road_safety_cameras_lifesavers_on_the_road.pdf October ). 2013). Google Scholar
R. F. Benekohalet al.,
“Automated speed photo enforcement effects on speeds in work zones,”
Transp. Res. Rec., 2055 11
–20
(2008). http://dx.doi.org/10.3141/2055-02 TRREDM 0361-1981 Google Scholar
C. GoldenbeldI. V. Schagen,
“The effects of speed enforcement with mobile radar on speed and accidents: an evaluation study on rural roads in the Dutch province Friesland,”
Accid. Anal. Prev., 37
(6), 1135
–1144
(2005). http://dx.doi.org/10.1016/j.aap.2005.06.011 AAPVB5 0001-4575 Google Scholar
G. ChenW. MeckleJ. Wilson,
“Speed and safety effect of photo radar enforcement on a highway corridor in British Columbia,”
Accid. Anal. Prev., 34
(2), 129
–138
(2002). http://dx.doi.org/10.1016/S0001-4575(01)00006-9 AAPVB5 0001-4575 Google Scholar
S. A. Bloch, Comparative study of speed reduction effects of photo-radar and speed display boards, 27
–36 National Research Council, Washington, D.C.
(1998). Google Scholar
N. L. Oei,
“The effect of enforcement on speed behaviour: a literature review,”
in 9th Int. Conf. Road Safety in Europe,
(1998). Google Scholar
P. RogersonS. NewsteadM. Cameron,
“Evaluation of the speed camera program in Victoria 1990–1991, Phase 3,”
(1994). Google Scholar
N. K. KanhereS. T. Birchfield,
“A taxonomy and analysis of camera calibration methods for traffic monitoring applications,”
IEEE Trans. Intell. Transp. Syst., 11
(2), 441
–452
(2010). http://dx.doi.org/10.1109/TITS.2010.2045500 1524-9050 Google Scholar
D. J. DaileyF. W. CatheyS. Pumrin,
“An algorithm to estimate mean traffic speed using uncalibrated cameras,”
IEEE Trans. Intell. Transp. Syst., 1
(2), 98
–107
(2000). http://dx.doi.org/10.1109/6979.880967 1524-9050 Google Scholar
S. PumrinD. J. Dailey,
“Roadside camera motion detection for automated speed measurement,”
in IEEE 5th Int. Conf. on Intelligent Transportation Systems,
147
–151
(2002). Google Scholar
T. N. SchoepflinD. J. Dailey,
“Dynamic camera calibration of roadside traffic management cameras for vehicle speed estimation,”
IEEE Trans. Intell. Transp. Syst., 4
(2), 90
–98
(2003). http://dx.doi.org/10.1109/TITS.2003.821213 1524-9050 Google Scholar
F. W. CatheyD. J. Dailey,
“A novel technique to dynamically measure vehicle speed using uncalibrated roadway cameras,”
in Proc. of IEEE Intelligent Vehicles Symp.,
777
–782
(2005). Google Scholar
N. K. KanhereS. T. BirchfieldW. A. Sarasua,
“Automatic camera calibration using pattern detection for vision-based speed sensing,”
in Transportation Research Board Annual Meeting,
30
–39
(2008). Google Scholar
J. Wuet al.,
“An algorithm for automatic vehicle speed detection using video camera,”
in Proc. of 2009 4th Int. Conf. on Computer Science & Education,
193
–196
(2009). Google Scholar
L. G. C. Wimalaratna1D. U. J. Sonnadara,
“Estimation of the speeds of moving vehicles from video sequences,”
in Proc. of the Technical Sessions,
6
–12
(2008). Google Scholar
L. GrammatikopoulosG. KarrasE. Petsa,
“Automatic estimation of vehicle speed from uncalibrated video sequences,”
in Int. Symp. Modern Technologies, Education and Professional Practice in Geodesy and Related Fields,
3
–4
(2005). Google Scholar
A. G. RadA. DehghaniM. R. Karim,
“Vehicle speed detection in video image sequences using CVS method,”
Int. J. Phys. Sci., 5
(17), 2555
–2563
(2010). IJPSLL 1992-1950 Google Scholar
P. Bellucciet al.,
“The SMART project—speed measurement validation in real traffic condition,”
in Proc. 8th International IEEE Conf. on Intelligent Transportation Systems,
874
–879
(2005). Google Scholar
R. Y. Tsai,
“A versatile camera calibration technique for high-accuracy 3D machine vision metrology using off-the-shelf TV cameras and lenses,”
IEEE J. Robot. Autom., 3
(4), 323
–344
(1987). http://dx.doi.org/10.1109/JRA.1987.1087109 IJRAE4 0882-4967 Google Scholar
Z. TianM. KyteH. Liu,
“Vehicle tracking and speed measurement at intersections using video-detection systems,”
ITE J., 79
(1), 42
–46
(2009). ITEJDZ 0162-8178 Google Scholar
J. ZhuY. F. ZhengR. E. Ewing,
“Measuring object speed using stereo tracking,”
in IEEE Int. Conf. on Robotics and Automation,
5949
–5954
(2011). Google Scholar
A. LaiN. Yung,
“Lane detection by orientation and length discrimination,”
IEEE Trans. Syst., Man, Cybern. B, 30
(4), 539
–548
(2000). http://dx.doi.org/10.1109/3477.865171 ITSCFI 1083-4419 Google Scholar
D. Baueret al.,
“Embedded vehicle speed estimation system using an asynchronous temporal contrast vision sensor,”
EURASIP J. Embedded Syst., 2007
(1), 082174
(2007). http://dx.doi.org/10.1186/1687-3963-2007-082174 1687-3955 Google Scholar
Imagsa, “Atalaya 3D: New dimension for speed,”
(2013) www.imagsa.com/main/images/datasheet/Atalaya3D_Speed.pdf October ). 2013). Google Scholar
KriaS.r.l. “T-REDSPEED: Advanced technology for Traffic Applications,”
(2013) http://project-asset.com/data/presentations/P_011-4.pdf October ). 2013). Google Scholar
J. Brandon,
“Russian super speed camera can issue thousands of tickets per hour,”
http://www.foxnews.com/leisure/2011/11/11/russian-super-speed-camera-can-issue-thousands-tickets-per-hour/ Google Scholar
D.-W. LimS.-H. ChoiJ.-S. Jun,
“Automated detection of all kinds of violations at a street intersection using real time individual vehicle tracking,”
in Fifth IEEE Southwest Symp. on Image Analysis and Interpretation,
126
–129
(2002). Google Scholar
J. Lee,
“Police crack down on blocking the box,”
(2013) http://cityroom.blogs.nytimes.com/2008/09/10/police-crackdown-on-blocking-the-box/ October ). 2013). Google Scholar
O. Fuciket al.,
“The networked photo-enforcement and traffic monitoring system Unicam,”
in Proc. of the 11th IEEE Int. Conf. and Workshop on Engineering of Computer-Based Systems,
423
–428
(2004). Google Scholar
Camea, “Red light monitoring,”
(2013) http://www.camea.cz/en/traffic-applications/enforcement-systems/ October ). 2013). Google Scholar
N. H. C. YungH. S. Lai,
“An effective video analysis method for detecting red light runners,”
IEEE Trans. Veh. Technol., 50
(4), 1074
–1084
(2001). http://dx.doi.org/10.1109/25.938581 ITUTAB 0018-9545 Google Scholar
Y. ChenC. Yang,
“Vehicle red-light violation detection base on region,”
in 3rd IEEE Int. Conf. on Computer Science and Information Technology,
700
–703
(2010). Google Scholar
“autoChalk: drive-by digital tire chalking using autoChalk,”
(2013) http://www.tannerycreeksystems.com/autoChalk-mobile.html October ). 2013). Google Scholar
Adaptive Recognition Hungary, “The CARMEN® Parking ANPR Software,”
http://www.anpr.net/anpr_09/anpr_parking.html Google Scholar
O. Bulanet al.,
“Video-based real-time on-street parking occupancy detection system,”
J. Electron. Imaging, 22
(4), 041109
(2013). http://dx.doi.org/10.1117/1.JEI.22.4.041109 JEIME5 1017-9909 Google Scholar
Biography Robert P. Loce is a research fellow and technical manager in the Xerox Research Center Webster. He joined Xerox in 1981 with an AAS degree in optical engineering technology from Monroe Community College. While working in optical and imaging technology and research departments, he received a BS in photographic science (RIT 1985), MS in optical engineering (UR 1987), and PhD in imaging science (RIT 1993). A significant portion of his earlier career was devoted to development of image processing methods for electronic printing. His current research activities involve leading an organization and projects into new video processing and computer vision technologies relevant to transportation and healthcare. He has publications and many patents in the areas of digital image processing, image enhancement, imaging systems, and optics. He is a fellow of SPIE and senior member of IEEE. His publications include a book on enhancement and restoration of digital documents, and book chapters on digital halftoning and digital document processing. He is currently an associate editor for Journal of Electronic Imaging, and has been and associate editor for Real-Time Imaging, and IEEE Transactions on Image Processing.  Edgar A. Bernal is a senior research scientist at the Xerox Research Center in Webster, N.Y., where he currently works on the development of video analytics, machine learning and novel sensing technologies for transportation and healthcare applications. Holding 14 issued U.S. patents and 56 additional patents pending, his research interests include multidimensional and statistical signal processing, image and video processing, computer vision, 3D imaging, compressive sensing, machine learning, and pattern recognition. Bernal holds MSc and PhD degrees in electrical engineering from Purdue University. He is a senior member of IEEE, and serves as vice chair of the Rochester chapter of the IEEE Signal Processing Society and as adjunct faculty at the Rochester Institute of Technology’s Center for Imaging Science. Bernal has co-authored 18 conference and journal publications, and is a reviewer of IEEE Transactions on Image Processing, the Journal of Electronic Imaging and the Journal of Imaging Science and Technology.  Wencheng Wu is a principal scientist at the Xerox Research Center in Webster, New York. He joined Xerox in 2000 with a PhD degree in electrical engineering from Purdue University. His earlier career focused on the areas of image quality metric developments, printer and sensor characterizations, image simulation and color modeling, and image processing algorithms for defect detection. His current research activities include computer vision, video processing, and video analytics for transportation applications. He has multiple papers and patents in areas related to his current and past research interests. He is a senior member of IEEE and a member of the Society of Imaging Science and Technology. He is also a frequent reviewer of IEEE Transactions on Image Processing, Journal of Electronic Imaging, and Journal of Imaging Science and Technology.  Raja Bala received a PhD in electrical engineering from Purdue University and is currently a principal scientist and project leader in the Xerox Research Center Webster. His research interests include mobile imaging, computer vision, video processing, and color imaging. He has served as adjunct faculty member in the School of Electrical Engineering at the Rochester Institute of Technology. Bala holds over 100 U.S. patents and has authored over 90 publications in the field of digital and color imaging. He has served as associate editor of the Journal of Imaging Science and Technology, and vice president of publications for the Society for Imaging Science and Technology. He is a frequent reviewer for IEEE Transactions on Image Processing, and Journal of Electronic Imaging. Bala is a fellow of IS&T. |
|||||||||||||||||||||||||||||||||||||||||||||||||||