|
|
1.IntroductionIn the digital era, various types of media, including audio, video, and images can easily be duplicated and distributed without permission from original owner/creator. This is undesirable because the consequences of such actions may discourage the owner/creator from developing future work. One possible solution to this problem is the use of digital watermarking to discourage people from making and distributing unauthorized copies of digital media.1 Image watermarking is a method used to embed information imperceptibly (the watermark) into a host image before public distribution. The degradation of a watermarked image must be unnoticeable by the observer of the image. The embedded watermark must be robust against both unintentional and intentional attacks while being extractable so the watermark can be “read”.2,3 A watermarking method used for image distribution should also be capable of blind detection so that the watermark can be extracted without the original image.4 At present, various image watermarking schemes have been proposed and shown to be robust against various types of attacks. Several of them embed a watermark within the transform domain of the host image5,6,7,8 so that the embedded watermark can survive most compression schemes, such as JPEG and JPEG2000. There are also some studies demonstrated that such approaches are robust against geometrical attacks, e.g., cropping.4,7,8 However, most methods suffer from low capacity in that few watermark bits can be added to the host image.9 A simple and fast approach, based on spatial domain watermarking, was thus considered as an alternative. It was shown in many studies that the embedded watermark can survive most of the geometrical attacks while simultaneously providing considerably high watermark capacity. For example, the blind watermarking method proposed by Verma et al. in 2007 described watermark embedding by modifying the pixel values in the blue (B) component of a color image.10 Note that the blue component was modified because the human visual system (HVS) is least sensitive to blue.1 In the scheme, a block from the predefined image was modified in such a way that watermark extraction could be achieved by comparing the average intensity of subsets of pixels of the block. An error-correcting code was used with the embedded bits in order to enhance the performance. However, this scheme provided a small watermark capacity of color image pixels. In 2008, another color image watermarking scheme based on linear discriminant analysis (LDA) was proposed, where all three color channels [i.e., red (R), green (G) and blue (B)] were used to carry a watermark in the form of a binary logo image. A trained LDA machine was used for watermark extraction.11 The scheme provided a small watermark capacity of color image pixels and also required a reference watermark to train the LDA in the extraction process. In 2009, a localized image watermarking resistant to geometric attacks was proposed by Li and Guo.12 In their scheme, the watermark was embedded into all local invariant regions repeatedly in the spatial domain of a color image and could be extracted from the distorted image directly with the help of an odd–even bit detector. Since the embedding positions were restricted to be within the local invariant regions in order to guard against geometric attacks (such as rotation, scaling, and translation), only a small number of bits (e.g., 16 bits) could be embedded into a gray level image. Recently, Hussein proposed a nonblind watermarking scheme based on log-average luminance13 whereby some blocks, which were chosen spirally from the center of the embedding image and had a log-average luminance greater than or equal to the log-average luminance of the entire image, were used for watermark embedding. However, in this scheme, apart from using an inconvenient nonblind approach, modifying the luminance components of host image significantly degraded the visual image quality which could be perceived by a human observer. Although the author avoided this drawback by allowing only 16 blocks to be modified, the performance of the method was limited to having a small watermark capacity, as only 1024 bits were embedded into color image pixels. A blind watermarking scheme based on the modification of image pixels enabling a large number of embedding bits was first proposed by Kutter et al.,14 where watermark embedding was performed by modifying the blue component of color image pixels, and watermark extraction was achieved by using a prediction method based on a linear combination of pixel values in a cross-shaped neighborhood around the embedded pixels. For this method, could be embedded into color image pixels. The method was experimentally observed to be robust against various types of image attacks, including geometrical attacks. The extraction performance was improved by introducing a Gaussian pixel-weighting mask into the embedding process and employing a linear combination of all nearby pixel values around the embedded pixel.15 However, if the number of watermark bits “1” and “” around the embedding pixel was not equal or balanced,16 the summation of those watermark bits would result in a large value, which directly affects the accuracy of the original pixel prediction step in the watermark extraction process, and the probability of extracting the watermark correctly would decrease. Such circumstances can frequently occur when a watermark that is to be embedded consists of recognizable patterns. The extraction probability also decreases when the host image is a very detailed image, that is when two nearby pixel values are substantially different. A similar concept of watermark embedding was also presented in Ref. 17, where the proposed perceptual mark was based on the adaptive least square (LS) prediction error sequence of the host image and claimed to match well with the properties of the HVS. Together with the new blind detection scheme based on an efficient prewhitening process and a correlation-based detector, their proposed mark exhibited impressive performance and the watermark capacity in the scheme was comparable to Ref. 15. However, the watermark embedding in the luminance component greatly degraded the perceptual quality of the watermarked image when compared with watermark embedding in the blue component at the same watermark strength. Watermark embedding in luminance translates to watermark embedding in all three color components, i.e., RGB. Thus, the resultant image quality will be degraded in accordance with the changes in each R, G, and B component. Based on the weaknesses in Ref. 15, three different improving techniques were proposed in Ref. 16. These techniques included balancing the watermark bits around the embedding pixel, tuning the strength of embedding watermark in accordance with nearby luminance components and reducing the effect caused by substantially different values between the nearby watermarked component and the center one in the prediction area. A different approach for improving the performance of this watermarking scheme was also presented in Ref. 18, where the watermark is embedded into the chrominance components of color space that have less variation value. Although it achieved a better extraction performance, the accuracy of the extracted watermark still suffered from most compression schemes, e.g., a low quality watermark was obtained after applying JPEG compression. We present in this article a new watermarking scheme based on the modification of image pixels in order to improve the accuracy of the extracted watermark and the robustness of the embedded watermark, as proposed in Refs. 1415.16.17.–18, especially against image compression standards. Three different methods are proposed to improve the overall performance. First, we propose a new watermark embedding method in the luminance component of the host image instead of the color component to avoid high lossy compression used in many image compression methods. This approach is usually overlooked because the quality of the host image will be severely dropped. Second, we reduce the number of watermark bits to be embedded, based on discrete wavelet transforms (DWTs) without decreasing the watermark image size in order to reduce the modifying number of the luminance components in the host image. Third, we propose a new watermark extraction method based on the prediction of original pixel from the weighted watermarked components in order to suit the high variation value of the watermarked luminance components. The performance of all three proposed methods is evaluated and compared with the previous watermarking schemes. The next section describes the proposed methods including our watermarking scheme. Section 3 presents the experimental settings and the performance of our proposed scheme, compared to the others. The conclusion is finally included in Sec. 4. 2.Proposed Methods2.1.Watermark Embedding Based on Luminance ModificationWe first consider embedding a watermark into a luminance component rather than in color components. This is because, in general, image compression methods strongly decrease the chrominance quality of a color image through subsampling processes.19 The watermark embedded in the luminance component should therefore be more robust against image compression than those in the color components. color space is one of the most well known models and widely used to present images. We thus choose the component in this color space, which is separately encoded, for watermark embedding. Recall that in color space, for example, represents the luminance component of a color image, whereas and represent the blue and red chrominance components, respectively.20 In addition, an image in RGB color space can be converted to , or vice versa, by the following equations: andHowever, since the HVS is very sensitive to changes in the luminance component, changing values of undoubtedly cause a more severe effect on perception than changes in the color and/or chrominance components. One efficient solution we consider here is to decrease the number of embedding bits in order to reduce the effect of the embedded watermark bits on the component while simultaneously improving the quality of the watermarked image. Nevertheless, this solution must neither affect the size of the embedded watermark nor excessively degrade its quality. Figure 1 shows the zoomed version of the host and watermarked images “Lena” for the and components. Figure 1(d) demonstrates the result obtained from embedding only of the watermark bits, with the same strength as used in Fig. 1(c), into the same host image. Note that the watermarking scheme in Ref. 16 was used in this test and the quality of watermarked image was controlled to achieve a peak signal to noise ratio (PSNR) of 30 dB. PSNR for watermarking embedding in the component is given by: where and are the original and watermarked component at coordinates (), whereas and are the numbers of the row and column in the image, respectively. In case of the component, and are replaced by and , respectively. Note that PSNR is an objective quality measure that is not consistent with HVS.Figure 1 shows that at the same PSNR, the quality of watermarked image in component, Fig. 1(c), was perceptually poorer than that in component, Fig. 1(b). However, when the number of watermark bits in the same component was reduced to of the original number, with the same strength, the change in quality is not very visible [see Fig. 1(d)], and the PSNR was increased to 43.3 dB. 2.2.Watermark Preparation/Reconstruction Based on DWTTo accomplish the embedding in the component without affecting the watermark excessively, we develop a new watermark consisting of three processing steps. The first two are based on the two-dimensional (2-D) DWT and are used to reduce the size of the embedding watermark and to enlarge the size of the extracted watermark to its original dimensions. The last processing step is based on image denoising and is used to diminish the negative consequences of propagation error. The 2D-DWT of function of size is defined as follows21: where is an arbitrary starting scale and the coefficients define an approximation of at scale . The coefficients add horizontal (H), vertical (V), and diagonal (D) details for scales . We normally let and select so that and , . , and in Eqs. (4) and (5) are defined as follows: where index identifies the directional wavelets as follows:Equation (6) identifies the scaling function as follows: In this article, we use the unit-height, unit-width scaling function and the Haar wavelet21 function for 2-D DWT in order to decompose an image to four quarter size subimages, namely, , , , and . Both the functions are given in Eqs. (12) and (13): andNote that the decomposition process can be used again to the approximation of the image to obtain another set of four subband images. The resulting decomposition of the image after doing the 2-D DWT two times is illustrated in Fig. 2. Fig. 2Examples of (a) original image (b) subimages after taking two 2-D discrete wavelet transform (DWT) decompositions.  It should be noted that can be reconstructed from and , and from and , via the inverse DWT. To use the 2-D DWT to construct our watermark, the watermark image with the same size of the host image is first created from a black-and-white recognizable pattern and then decomposed two times using 2-D DWT to obtain seven subimages. Next, each coefficient in (see Fig. 2) is modified to obtain a two-level value by the following: where is the modified coefficient in . Note that since the value of varies from 0 to 4, we use the value 2 at the midpoint of this range as a threshold to convert to . The resulting size of the subimage is used as the watermark and contains only 6.25% of the watermark bits from the original version. The seven subimages obtained after two 2-D DWT decompositions to the two-color, black-and-white image “Scout Logo” are illustrated in Fig. 3.Fig. 3Example of (a) original image “Scout Logo” and (b) its corresponding subimages after two 2-D-DWT decompositions.  When the extracted watermark is recovered, the second step is applied in order to reconstruct to its original size. That is, each coefficient is modified in accordance with the following equation to obtain a two-level value . The new subimage containing together with the new recreated subimages and containing all zero coefficients are inverse transformed to reconstruct the watermark image in its original size. Note that the values of lower and upper bounds, i.e., 0 and 4, are used in Eq. (16) because, based on observations, the quality of the reconstructed image using these two values is closer to the original image than with any other value. However, in the second step, if an erroneous coefficient in occurs, this will lead to a group of 16 erroneous pixels in . Hence, in the last step, a denoising filter with the following property is applied to to reduce the effect of the propagation error. Note that this image denoising technique works in such a way that the output pixel value depends on the majority of being within an area of . The example of subimage from the image Scout Logo together with six new recreated subimages and its enlarged version is shown in Fig. 4(a) and 4(b), while the extracted watermark images Scout Logo before and after the denoising filter are shown in Fig. 4(c) and 4(d), respectively. Fig. 4(a) Example of subimage and six new recreated subimages and (b) its enlarged version (c) the extracted watermark images Scout Logo before the denoising filter and (d) after the denoising filter.  Based on the above watermark construction, a new watermarking scheme based on luminance modification is proposed. The block diagram showing steps in watermark embedding is illustrated in Fig. 5. The steps in the watermark embedding process are as follows: First, after obtaining the reduced size of by the 2-D DWT decompositions, is XORed with a pseudorandom bit stream of the same length generated by a key-based stream cipher in order to obtain a balanced set of bits around the embedding component and thus providing security for the embedded watermark. That is, without the secret key, no one can reproduce the same pseudorandom bit stream used in the embedding processing, and as a result would be unable to recover the embedded watermark. The bit positions of the result are then permuted and spread in accordance with the uniform distribution to disperse groups of 0 and 1 bits over the entire embedding area. In practice, all watermark bits are first permuted and spread randomly based on the uniform distribution over pixel positions. Finally, the 0 bits are converted into so that the watermark to be embedded becomes . Note that the remaining () pixels of the host image remains unchanged. To watermark a host color image, the luminance component of the host image at coordinate () is pseudorandomly modified by using addition or subtraction, depending on the value of , the watermark strength , and the luminance component of the embedding pixel . The tuning factor, , is included here in order to control the overall quality of the watermarked image. In practice, is a constant value used to achieve an expected PSNR and may be different depending on the host image. According to Eq. (1), the luminance component is determined by . Note that no luminance component of the host image is embedded two times, so that only of the entire luminance component is modified. The watermarked luminance component can be represented by: where is the modified luminance value of the pixel block obtained from the Gaussian pixel-weighting mask,15 which is considered as an HVS-based tuning factor for watermark strength. In practice, must be carefully selected to obtain the best trade-off between imperceptibility and robustness.2.3.Original Pixel Prediction Based on Weighted ComponentsThe block diagram showing steps in the proposed watermark extraction process is illustrated in Fig. 6. From the figure, an embedded watermark can be recovered based on two assumptions. First, we assume that any pixel value within an image is close to its surrounding neighbors so that a pixel value at a given coordinate () can be estimated using the average of the values of its nearby pixels. Hence, a prediction of , which we denote as , is determined from the nearby watermarked components around () as follows: Second, we assume that the summation of around () is close to zero so that the embedded bit at () can be estimated by the following equation: It was shown in Ref. 16 that replacing a surrounding neighbor around () that most differed from by itself can help improve the accuracy of . Since can be either positive or negative, the zero value is set as its threshold, and its sign is used to estimate the value of . That is, if is positive (or negative), is estimated as 1 (or ). Note that the magnitude of reflects the confidence level of estimating . Last, the bit of is converted into 0, and the result is despread, repermuted and then XORed with the same pseudorandom bit stream used in the embedding process to obtain the recovered, black-and-white image . Note that the same pseudorandom bit stream can be reproduced if the watermark detector knows the secret key. From the above two assumptions, the accuracy of the extracted watermark depends mainly on the variation of the image pixels. For example, the two neighbor pixels having highly different values have a high chance of obtaining an error prediction for . In fact, the variation of the component after being watermarked using the above scheme always increases, and hence, unavoidably causes a lower accuracy on watermark extraction. To enhance the performance of estimation of the component, we consider using a new prediction technique for , taking into account the different values between two nearby components, i.e., the center and its neighbor. That is, instead of using the true value of the neighbor component around () in the prediction process, we first apply a weighting factor to every neighbor component around (), so that all neighbor components get closer to the center pixel. Conceptually, the weighting factor is determined based on the different values between the predicting component and its neighbors. Since, as mentioned earlier, a component value at coordinates () is assumed to be predicted from its neighbors, and the neighbor component value should be close to the predicting one. Also, since the range of values for the component varies from 16 to 235 and the different values between the two components can be varied from 0 to 219, the weighting factor is applied directly to the nearby component in accordance with the difference between that component and the predicting one. Based on this concept, the weighted neighbor component around of an area pixels can be represented by the following equation: where is a constant value used to adjust the weighted component, and , 0, 1. Finally, a new prediction of , which we denote as , is given by:Note that , and is now obtained by: The differences between the proposed watermarking scheme and the previous equivalent schemes are summarized in Table 1. Note that, in comparison, we concentrated on the watermarking scheme that can embed the two-color watermark image having the same size as the original host image only. Table 1Differences between five image watermarking schemes.
3.Experimental ResultsIn all the experiments, sixteen pixel color images having various characteristics, namely, “Lena,” “Airplane,” “Fish,” “Pepper,” “Tower,” “Baboon,” “House,” “Bird,” “Always running,” “A water trick,” “Couple,” “Golden Gate,” “Sail boat on lake,” “San Francisco,” “Splash,” and “Tree” were used as original host images. Most of them were taken from Refs. 22 and 23. A black-and-white image of the same size as the host image Scout Logo was created and used as the watermark. To obtain a fair comparison between different watermarking schemes, the embedding parameters used in each scheme were adjusted until the quality of watermarked images reached quality image at PSNR of 35 dB.24 When the watermark was extracted, its accuracy was evaluated by a metric known as the normalized correlation (NC). The robustness of the embedded watermark was also evaluated by the NC. The NC is a similarity measurement between two different signals, which is given as follows: Normally, when two different versions of watermark are compared, the value of NC varies from 0 to 1, provided that each comparing watermark contains at least one component representing the value of 1. Note that the value of implies that two compared signals are identical. Also, the higher the NC is, the more accurate the extracted watermark will be. Apart from using the NC, the quality of the extracted watermark may be evaluated without comparing it to the original version. Since the watermark image contains recognizable patterns and/or logos, its quality may be judged from the intelligibility of its content. In this article, we mainly used the NC to evaluate the performance of the watermarking schemes though we sometimes used human observers to rapidly validate the extracted watermark. For the experiments, we first explored the impact of the proposed watermark embedding method and the proposed original image prediction technique separately, before employing them in our watermarking scheme. We then evaluated and compared the performance of our scheme with the previous schemes under the same circumstance, i.e., embedding a black-and-white image into a color image of the same size. Finally, we evaluated and compared the robustness of the seven watermarking schemes against various types of attacks including JPEG-based compression schemes. Two of them were in fact adapted from the blue component embedding method in Kutter’s and Amornraksa’s schemes to the component and denoted by and , respectively. 3.1.Impacts of the Proposed MethodsTo demonstrate that the proposed watermark constructed for the component helped to improve the accuracy of the extracted watermark, the root mean square error (RMSE) between the extracted and original watermarks, that is, and , was measured to observe the performance of the proposed method versus existing methods. Note that a smaller value of RMSE indicates a lesser difference between two components. The results in terms of average RMSE at various PSNR from the watermarking scheme in Ref. 16 with different embedding methods and channels discussed above are shown in Fig. 7. In the figure, we denote the embedding methods of Kutter, Karybali, Amornraksa, and the proposed one, as described in Table 1, by , , , , , and , respectively. The proposed method achieved the highest accuracy with respect to the extracted watermark as compared to the other methods. Fig. 7Comparison of average root mean square error (RMSE) from different embedding methods at various peak signal to noise ratios (PSNRs).  We then demonstrate that the quality of the predicted image obtained from the weighting-based prediction method is closer to the original image than that obtained from other existing methods. Again, we measured the RMSE between the predicted and original components for every embedding position in order to observe the difference between various prediction methods. For instance, in the component, RMSE is computed from and , while in the component, from and . Note that in this situation, a smaller value of RMSE indicates a better prediction of the original component. The results of RMSE averaged from all host images based on various PSNR from the watermarking scheme in Ref. 16 with different prediction methods described in Table 1 are presented and compared in Fig. 8. From the figure, we denote the prediction methods of Kutter, Karybali, Amornraksa, and the proposed one by , , , and , respectively. The results verified that our prediction method obtained the highest quality predicted image at all PSNR values. Note that in the case of pixel prediction at the edge of image, the value of the missing pixels was replaced by the nearest pixel. Note that the Hussein scheme13 was not compared here because it does not need the prediction step. 3.2.Performance ComparisonFirst, we needed to identify the value of NC used to differentiate the extracted watermark from the fake one. To accomplish this, we deployed a watermark counterfeit attack by computing the average value of NC of the watermark extracted from all watermarked testing images and comparing the results from the seven watermarking schemes with 993 different watermarks. In the experiments, the quality of all watermarked images was controlled to achieve 35 dB, and the value of was set to 0.475 to obtain the best prediction performance. Note that was obtained experimentally by a full-search approach. That is, by searching the value of that gave the highest NC value, on average, from all testing images. In the experiments, the value of was varied in step of 0.1, from 0 to 1. According to the results shown in Fig. 9, the average NC value between the extracted genuine watermark and the other 993 watermarks was approximately 0.5. Hence, if the values of NC for an extracted watermark was lower than 0.5, the watermark could be presumed to be a fake. This threshold may be used to indicate the absence of an embedded watermark as well because the value of NC for a valid watermark after the XORing step was equivalent to that obtained by using a pseudorandom bit stream (7 genuine and 993 random watermarks). Now, we compared the performance of the seven watermarking schemes. The results in terms of average NC at various PSNR are presented in Fig. 10. The proposed scheme outperforms the other schemes. It should be noted that the performance of was not good even though it used the original host image to help extract the watermark. This is because the black and white logo with the same size as the host image was used in the experiments, and some image areas having too low log-average luminance were not used to carry watermark bits. Fig. 10Comparison of average NC obtained from different watermarking schemes at various PSNRs from different watermarking schemes at various PSNRs.  Examples of the original color image Lena, which included the two-color, black-and-white watermark Scout Logo, the watermarked image and the extracted watermark using the seven different schemes at PSNR of 35 dB are given in Fig. 11. The values of average NC obtained from , , , , , , and were 0.8430, 0.7396, 0.7226, 0.8260, 0.8603, 0.8229, and 0.9643, respectively. Since embedding a watermark with the same strength to different components will result in different PSNRs, the watermarked images from different schemes and components were then fairly compared with another objective quality measure that matches well with the HVS properties, i.e., the weighted PSNR (wPSNR) taken from checkmark.25 The wPSNR is an adaptation of PSNR that introduces different weights for the perceptually different image areas taking into account that the visibility of noise in flat image areas is higher than that in textures and edges.26 The calculation of wPSNR is given by: where NVF is noise visibility function which characterizes the local texture of the image and varies between 0 and 1, where it takes 1 for flat areas and 0 for highly textured regions.26 In this experiment, the wPSNR values from all testing watermarked images at PSNR of were evaluated and compared. The results in terms of average among the seven watermarking schemes are shown in Table 2. Obviously, the average value from the proposed watermarking scheme was slightly lower than the three comparing schemes, i.e., , , and .Table 2Comparison of the average wPSNR at PSNR of 35±0.01 dB.
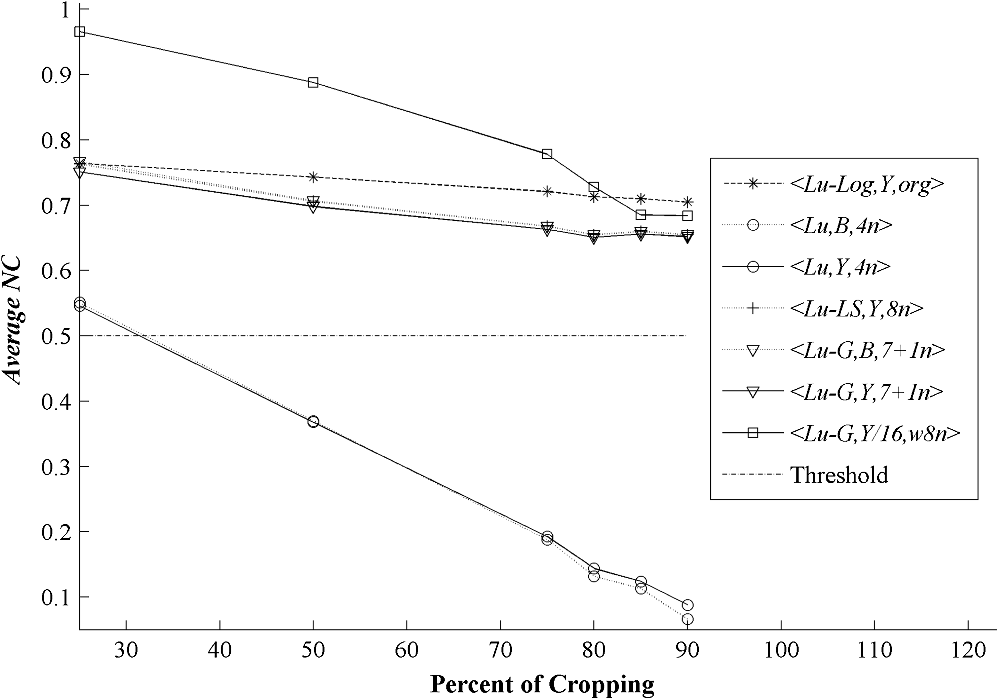
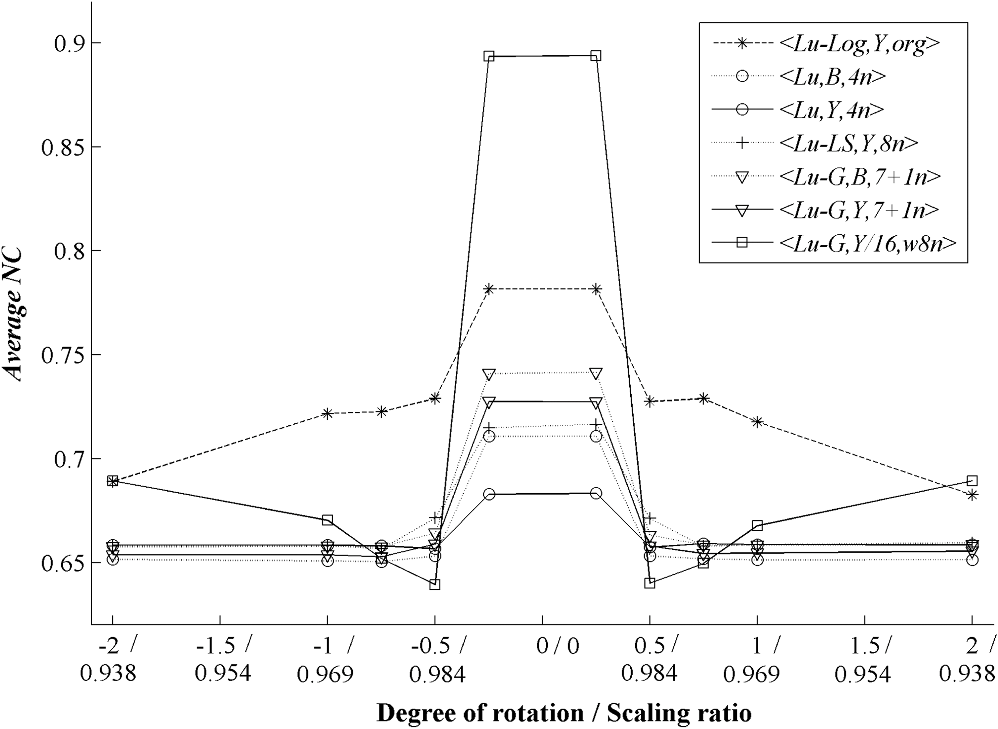
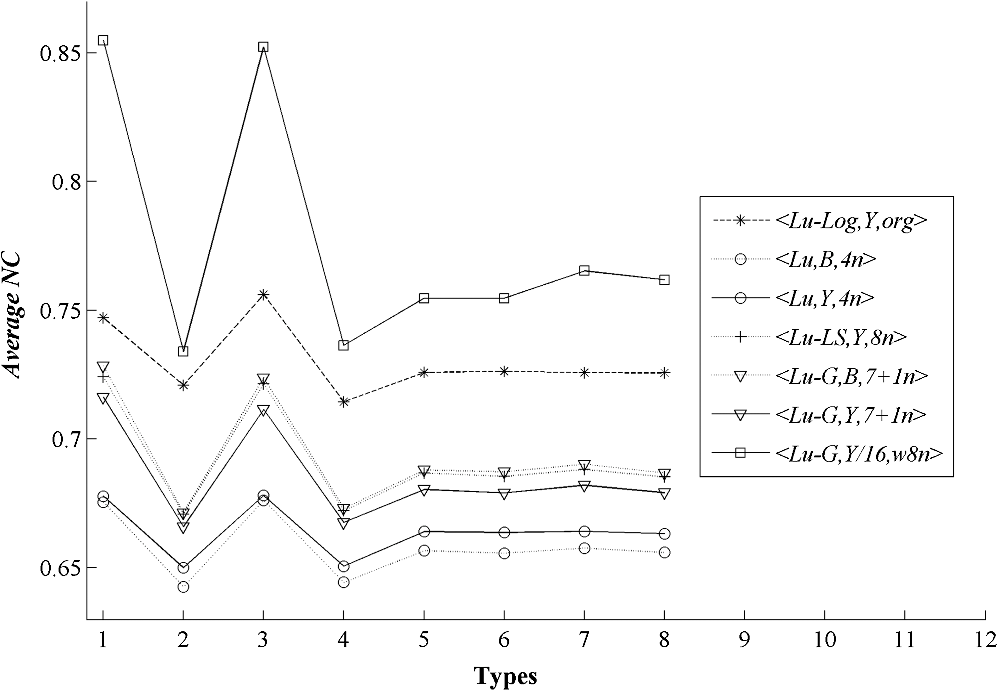
3.3.Robustness Against AttacksThe various types of attacks were next implemented against the watermarked images using the Stirmark benchmark (version 4)27,28 and common image processing techniques. We then tried to extract the embedded watermark. After the attacks, if the size of the attacked image was different from its original version, we rescaled it to obtain the original size. In the case of a cropped image, we replaced the missing part(s) of the image by white pixels. It should be noted that the quality of all attacked images fell below 35 dB, depending on the type and strength of the attack. As demonstrated in Figs. 12Fig. 13–21 and Table 3, the average NC from the proposed scheme of the extracted watermark after being attacked was superior to the other schemes. Table 3Robustness comparison against various types of attack.
The examples of the watermarked image Lena using the proposed scheme after JPEG compression at 100% and 75% quality factor, which included the corresponding extracted watermark Scout Logo using the seven different schemes, are shown in Fig. 22, whereas similar examples after JPEG2000 with compression ratios of and and decompression layers of 5 are shown in Fig. 23. Fig. 22The JPEG compressed watermarked image at (a) 100% and (b) 75% quality factor. (c) Examples of the extracted watermarks from the seven watermarking schemes. 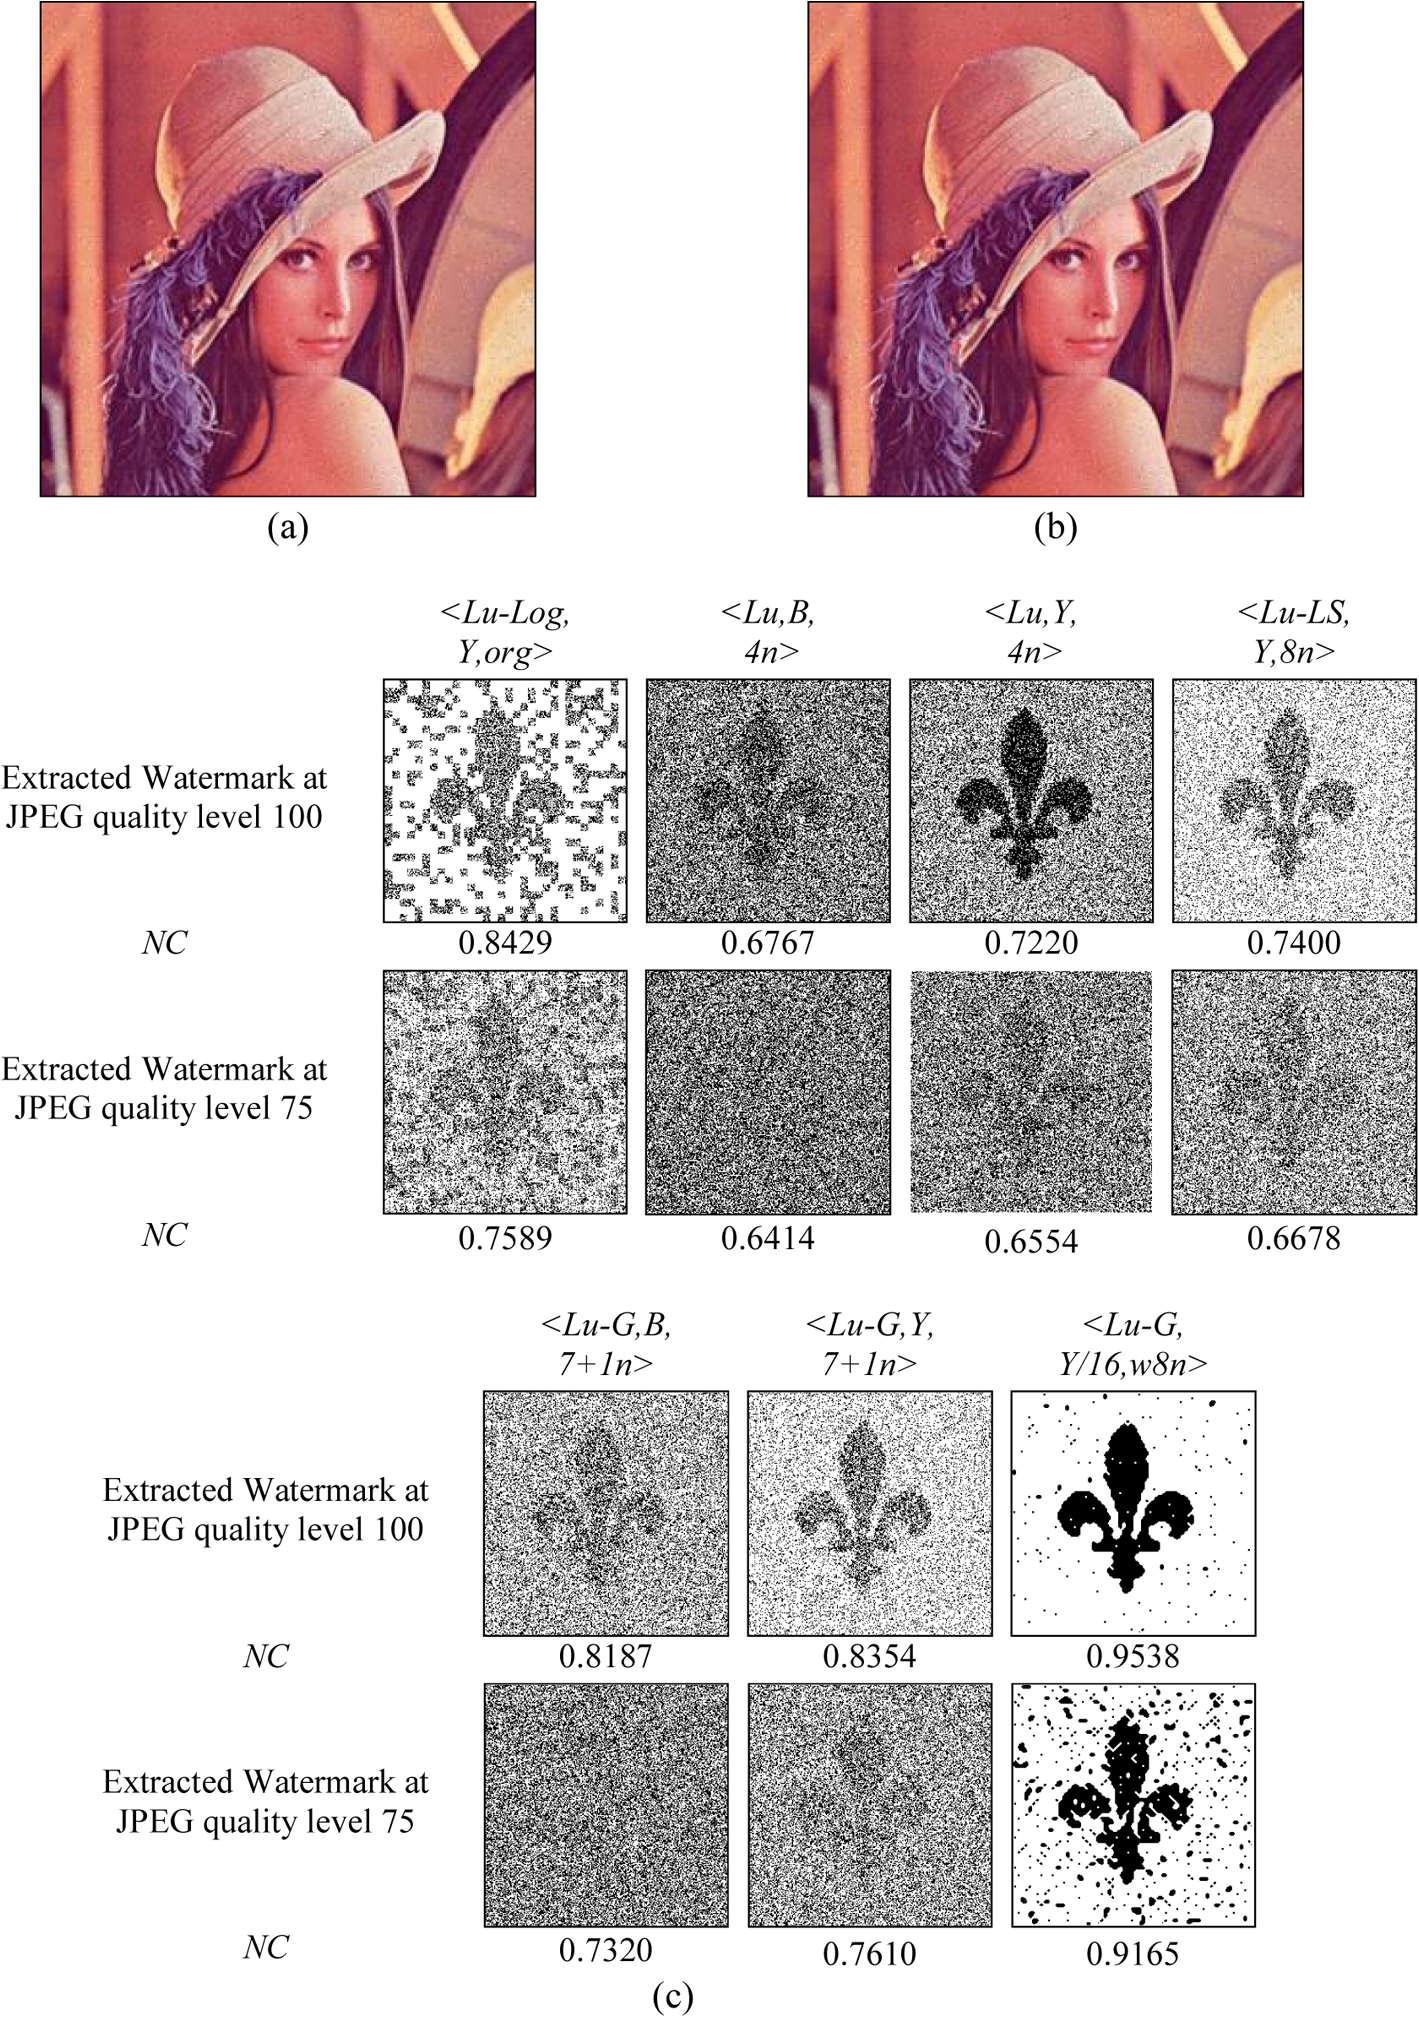 Fig. 23The JPEG 2000 compressed watermarked image at compression ratio of (a) and (b) . (c) Examples of the extracted watermarks from the seven watermarking schemes.  Finally, we demonstrated the robustness of the embedded watermark against watermark removal. In this experiment, the predictions for the () components as well as the and components were combined together to recreate an image without a watermark. The same process was applied to the resulting image several times with the aim of completely removing the embedded watermark. For example, the first-round combination was , the second round combination was , and so on. The values of NC for the watermark extracted from different versions of the recreated image Lena and based on the four watermarking schemes are given in Table 4. Again the Hussein scheme13 was not included because it has no prediction step. The results obtained from the table confirmed that the embedded watermark still remained within all versions of the recreated image and could be reliably extracted. Also note that after the first round, the PSNR of the recreated image fell below 35 dB and became lower with each round it was recreated in. Table 4Robustness comparison against watermark removal attack.
4.ConclusionsWe have presented a new image watermarking scheme based on luminance modification. The watermark was embedded into the luminance component of the host image without significant perceptible degradation. The luminance component prediction using the concept of a weighting factor was also employed to enhance the performance of the proposed watermarking scheme. The experimental results showed significant improvement in the proposed watermarking scheme in terms of accuracy of the extracted watermark and robustness of the embedded watermark, compared with the previous existing schemes, especially against two popular image compression methods, JPEG and JPEG2000. For a practical system, other techniques such as error control coding or multiple embedding might be incorporated to provide extra reliability for watermark extraction, provided the complexity in the new system is not too high and enough watermark bits can still be embedded. AcknowledgmentsThis research work was supported by the Commission on Higher Education scholarship (CHE-PhD-SW-NEWU) granted to Mr. Narong Mettripun. The authors would like to sincerely thank Mr. Suwat Tachaphetpiboon and Miss Kharittha Thongkor for their fruitful discussions. ReferencesI. J. Coxet al., Digital Watermarking, and Steganography, 2nd Ed.Morgan Kaufmann Publishers, Burlington, Massachusetts
(2008). Google Scholar
J. J. K. O’RuanaidhW. J. DowlingF. M. Boland,
“Watermarking digital images for copyright protection,”
143
(4), 250
–256
(1996). Google Scholar
M. BarniF. Bartolini, Watermarking Systems Engineering Enabling Digital Assets Security and Other Application, 1st Ed.Marcel Dekker, Inc., New York
(2004). Google Scholar
F. Y. Shih, Digital Watermarking And Steganography Fundamentals and Techniques, 1st Ed.CRC Press, Boca Raton, Florida
(2007). Google Scholar
C. V. Serdeanet al.,
“Wavelet and multiwavelet watermarking,”
IET Image Process., 1
(2), 223
–230
(2007). http://dx.doi.org/10.1049/iet-ipr:20060214 1751-9659 Google Scholar
S. Agresteet al.,
“An image adaptive, wavelet-based watermarking of digital images,”
J. Comput. Appl. Math., 210
(1–2), 13
–21
(2007). http://dx.doi.org/10.1016/j.cam.2006.10.087 JCAMDI 0377-0427 Google Scholar
A. PoljicakL. MandicD. Agic,
“Discrete Fourier transform–based watermarking method with an optimal implementation radius,”
J. Electron. Imaging, 20
(3), 033008
(2011). http://dx.doi.org/10.1117/1.3609010 JEIME5 1017-9909 Google Scholar
X. KangJ. HzangW. Zeng,
“Efficient general print-scanning resilient data hiding based on uniform log-polar mapping,”
IEEE Trans. Inform. Forensics Secur., 5
(1), 1
–12
(2010). http://dx.doi.org/10.1109/TIFS.2009.2039604 1556-6013 Google Scholar
J. Seitz, Digital Watermarking for Digital Media, Information Science Publishers, Hershey, Pennsylvania
(2005). Google Scholar
B. VermaD. P. AgarwalS. Jain,
“Spatial domain robust blind watermarking scheme for color image,”
Asian J. Inform. Technol., 6
(4), 430
–435
(2007). 1682-3915 Google Scholar
Y. G. FuR. Shen,
“Color image watermarking scheme based on linear discriminant analysis,”
Comput. Stand. Interfaces, 30
(3), 115
–120
(2008). http://dx.doi.org/10.1016/j.csi.2007.08.013 CSTIEZ 0920-5489 Google Scholar
L. LiB. Guo,
“Localized image watermarking in spatial domain resistant to geometric attacks,”
AEU Int. J. Electron. Commun., 63
(2), 123
–131
(2009). http://dx.doi.org/10.1016/j.aeue.2007.11.007 1434-8411 Google Scholar
J. A. Hussein,
“Spatial domain watermarking scheme for colored images based on log-average luminance,”
J. Comput., 2
(1), 100
–103
(2010). Google Scholar
M. KutterF. JordanF. Bossen,
“Digital watermarking of color images using amplitude modulation,”
J. Electron. Imaging, 7
(2), 326
–332
(1998). http://dx.doi.org/10.1117/1.482648 JEIME5 1017-9909 Google Scholar
R. PuernpanT. Amornraksa,
“Gaussian pixel weighting marks in amplitude modulation of color image watermarking,”
in Proc. Int. Conf. IEEE ISSPA,
194
–197
(2001). Google Scholar
T. AmornraksaK. Janthawongwilai,
“Enhanced images watermarking based on amplitude modulation,”
Image and Vision Comput., 24
(2), 111
–119
(2006). http://dx.doi.org/10.1016/j.imavis.2005.09.018 IVCODK 0262-8856 Google Scholar
I. G. KarybaliK. Berberidis,
“Efficient spatial image watermarking via new perceptual masking and blind detection schemes,”
IEEE Trans. Inform. Forensics Secur., 1
(2), 256
–274
(2006). http://dx.doi.org/10.1109/TIFS.2006.873652 1556-6013 Google Scholar
K. SurachatT. Amornraksa,
“Pixel-wise based digital watermarking in color space,”
in Proc. Int. Conf. PCM 2009,
1293
–1299
(2009). Google Scholar
P. Symes, Video Compression Demystified, 1st Ed.McGraw-Hill, New York
(2001). Google Scholar
“Studio encoding parameters of digital television for standard , and side-screen aspect ratios,”
(1995). Google Scholar
R. C. GonzalezR. E. Woods, Digital Image Processing, 2nd Ed.Prentice Hall, Upper Saddle River, New Jersey
(2002). Google Scholar
The USC-SIPI Image Database, “Signal and image processing institute,”
(2010) http://sipi.usc.edu/database ( June ). 2010). Google Scholar
IRTC Viewing and Voting (Stills), “Results for September-October 1998,”
(2010) http://www.irtc.org/stills/1998-10-31.html ( June ). 2010). Google Scholar
M. LiS. NarayananR. Poovendran,
“Tracing medical images using multi-band watermarks,”
in Proc. IEEE Int. Conf. Engineering in Medicine and Biology Society (IEMBS ’04),
3233
–3236
(2004). Google Scholar
CheckMark, Vision Group University of Geneva,
(2013) http://cvml.unige.ch/ResearchProjects/Watermarking/Checkmark/ ( May ). 2013). Google Scholar
S. Voloshynovskiyet al.,
“Attack modelling: towards a second generation benchmark,”
Signal Process., 81
(6), 1177
–1214
(2001). http://dx.doi.org/10.1016/S0165-1684(01)00039-1 SPRODR 0165-1684 Google Scholar
F. A. P. Petitcolas,
“Watermarking schemes evaluation,”
IEEE Signal Process. Mag., 17
(5), 58
–64
(2000). http://dx.doi.org/10.1109/79.879339 ISPRE6 1053-5888 Google Scholar
F. A. P. PetitcolasR. J. AndersonM. G. Kuhn,
“Attacks on copyright marking systems,”
in Proc. 2nd Int. Workshop on Information Hiding (IH’98),
218
–238
(1998). Google Scholar
Biography Narong Mettripun received a MSc degree in computer engineering from King Mongkut’s University of Technology Thonburi (KMUTT), Thailand, in 2004. He is currently a lecturer in the Electrical Engineering Department, Rajamangala University of Technology Lanna Chiang Rai. He is now pursuing a PhD degree in electrical and computer engineering at KMUTT. From July 2011 to July 2012, he was a visiting researcher at Video and Image Processing Laboratory, Department of Electrical and Computer Engineering, Purdue University, USA.  Thumrongrat Amornraksa received MSc and PhD degrees from University of Surrey, England, in 1996 and 1999, respectively. He is currently an associate professor in the Computer Engineering Department, King Mongkut’s University of Technology Thonburi (KMUTT). His research interests are digital image processing and digital watermarking.  Edward J. Delp received his BSEE and MS degrees from the University of Cincinnati, and a PhD degree from Purdue University. In 2002, he received an Honorary Doctor of Technology from the Tampere University of Technology in Tampere, Finland. He is currently The Charles William Harrison Distinguished Professor of Electrical and Computer Engineering and Professor of Biomedical Engineering and Professor of Psychological Sciences (Courtesy) His research interests include image and video compression, multi-media security, medical imaging, multimedia systems, communication, and information theory. He is a Fellow of the IEEE, a Fellow of the SPIE, a Fellow of the Society for Imaging Science and Technology (IS&T), and a Fellow of the American Institute of Medical and Biological Engineering. In 2008 Dr. Delp received the Society Award from IEEE Signal Processing Society (SPS). This is the highest award given by SPS for his work in multimedia security and image and video compression. |
|||||||||||||||||||||||||||||||||||||||||||||||||||||||||||||||||||||||||||||||||||||||||||||||||||||||||||||||||||||||||||||||||||||||||||||||||||||||||||||||||||||||||||||||||||||||||||||||||||||||||||||||||||||||||||||||||||||||||||||||||||||||||||||||||||||||||||||