
|
|
1.IntroductionIn multi-aperture optics, a single optical system is replaced by an array of optical channels side by side. In a single-aperture system, its focal length and pixel pitch determine the rate it samples object space. In a multi-aperture system, this relation can be broken up by interlacing the views of adjacent channels so that they supersample object space. After capture, the channel microimages are assembled digitally to obtain a continuous image. Using this principle, the system thickness can be reduced while keeping sampling of object space constant. When the optics is considered to be diffraction-limited, however, either sensitivity or effective resolution has to be sacrificed.1 On the other hand, when system thickness is reduced, lens dimensions are reduced along with it. multi-aperture systems are often realized with micromanufacturing techniques, which are more accurate for lenses with small diameters and sags, leading to better optical performance. We examine the balance of these two effects using the electronic cluster eye (eCLEY)2 as one example of a multi-aperture system. The eCLEY uses supersampling to reduce system thickness and lens dimensions. Additionally, the total field of view of the system is divided; each channel only images a small field of view. After reviewing related work in this area (Sec. 2), we discuss performance scaling and manufacturing issues in Sec. 3. Next, we treat the effects of image reconstruction on sharpness and noise (Sec. 4). We then compare the theoretical results to the actual performance of the eCLEY using measurements of the modulation transfer function (MTF) and the temporal noise in Sec. 5. Finally, we compare the MTF with a state-of-the-art single-aperture camera manufactured with wafer-level optics. 2.Related WorkAn early small multi-aperture system was TOMBO,3 which uses a low number of identical channels with the same viewing direction. The same principle has also been applied to macroscopic infrared focal plane arrays for remote sensing applications.4 Flexible laboratory setups such as the Stanford large camera array have been valuable to investigate possible applications and configurations of multi-aperture systems, as well as yielding practical insights on how to calibrate these systems.5 The eCLEY, in contrast, is specifically designed for precise and cost-effective manufacturing with microfabrication techniques and contains unique channels with different viewing directions. Supersampling with multi-aperture systems is a natural extension of super-resolution from video sequences. Park et al.6 have conducted a comprehensive review of existing methods. Registration techniques as well as reconstruction algorithms have been adapted to multi-aperture systems, for example by Nitta et al.7 and Kanaev et al.8,9 However, for images from real-world systems, simple shift-and-add schemes preceded by calibration with sub-pixel accuracy have remained popular, for example as reported by Kitamura et al.10 An extended version of this type of scheme is also used for reconstructing images from the eCLEY.11 Independent of the applied reconstruction algorithm, the theoretical performance limits of thin optical systems were comprehensively investigated by Haney.1 He concludes that multi-aperture systems with reduced length can only match the performance—sensitivity and resolution—of single-aperture systems at a significant increase in footprint. Measurements of both sensitivity and resolution from experiments are rare. Figures for peak signal-to-noise ratio comparing ground truth with a simulation are stated most frequently, along with example images from the actual system. Portnoy et al.4 give contrast measurements for a single frequency along with the signal-to-noise ratio. We provide an analysis of the sensitivity and the resolution of multi-aperture, systems. We confirm our theoretical model with measurements of the MTF and the temporal noise of a specific system, the electronic cluster eye, which is described in Sec. 3. 3.Scaling in Multi-Aperture SystemsIn this section, we discuss scaling in general multi-channel systems. As we will see with the example of the eCLEY, there are two aspects to any multi-aperture configuration that have different impacts on system volume and performance. The eCLEY is based on the principle of interlaced tiles, as introduced in Ref. 2. Each optical channel of the eCLEY has a small field of view (FOV) and a unique viewing direction. The FOVs of adjacent channels overlap, together creating a larger FOV (Fig. 1). Their viewing directions are carefully tuned, so that pixels of one channel sample object space inbetween pixels of the adjacent channels (Fig. 2). In practice, one pixel does not have a discrete viewing direction; it integrates light over a solid angle. The implications are discussed in Sec. 3.2. Fig. 1The field of view of the (eCLEY) is segmented into multiple channels, each viewing a part of the total FOV. The FOVs of the channels overlap. Here, three channels are shown in different colors, in one dimension. The actual eCLEY has channels. 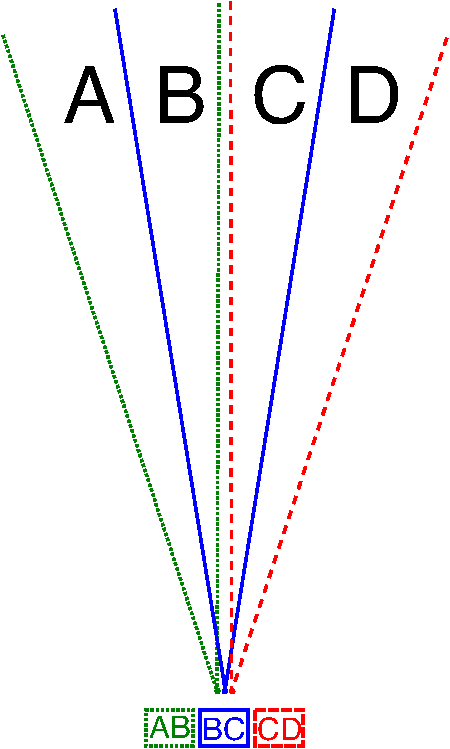 Fig. 2The viewing directions of the eCLEY channels are adjusted carefully so that the pixels of one channel sample object space between the pixels of the adjacent channel. Three channels shown in one dimension, with seven pixels for each channel. The eCLEY has pixels per channel.  These two aspects of the concept serve specific purposes:
Both aspects act in concert to decrease lens diameters. Interleaving achieves this goal directly, because at the same -number, a smaller focal length leads to smaller lens diameters. Segmentation achieves the same goal indirectly, as less complex lens systems tend to have smaller lens diameters: The further away a lens is from the aperture stop, the larger it has to be to avoid vignetting of marginal rays. The more lenses a system has, the larger the axial extent of the system, leading to large lenses far away from the aperture. We now investigate how multi-aperture systems compare to single-aperture systems in terms of light collection efficiency, resolution and physical size. For better clarity, we treat the effects of segmentation and supersampling separately. 3.1.Light CollectionFirst, we determine the light collection efficiency of a single-aperture system. Consider a setup with a scene emitting the radiance , a lens with diameter and effective focal length , and an image sensor [Fig. 3(a)]. The sensor has the extent , divided into pixels with a pitch of . From the image plane, the lens subtends a solid angle of Fig. 3Geometric properties of a single-aperture system (a) and two multi-aperture systems, supersampling (b) and segmenting (c) with lens diameter , focal length , image height , and field of view . The lens subtends an angle at the image plane.  As the aperture takes on the radiance of the scene,12 the sensor receives an irradiance of with the lens having an optical transmittance of . Each pixel integrates over its photosensitive area, collecting a radiant flux of where is the fill factor of the pixel. The total flux collected by the sensor is neglecting effects such as distortion or vignetting.We discuss a supersampling multi-aperture system next [Fig. 3(b)]. To decouple sampling rate from pixel pitch, the single optical system is replaced by channels side by side, with the supersampling factor . In case of the eCLEY, the supersampling factor is 2, though the number of channels is higher because the FOV is segmented. Each channel is a scaled version of the original system (see Ref. 2), so , and each system retains the F-number of the original camera. Therefore, in each system, . Consequently, each pixel records the same flux as in the single-aperture case. As the system samples the same FOV (solid angle) as the original system with the same sampling rate, the total amount of samples—or pixels—stays the same. Therefore, Next, we segment the FOV of the camera into channels [Fig. 3(c)]. In case of the eCLEY, is 8 horizontally and 6 vertically. The geometry of each of these channels is identical to that of the original optical system: Both and stay the same. The FOV of each channel is limited, however, by reducing the image size in each channel. The viewing direction of the channel is selected by introducing a lateral offset between optical system and image. Again neglecting distortion and vignetting, in each channel, partial FOV is and image size is . As sampling rate and pixel size are kept the same, each channel now uses pixels. If either distortion or vignetting are not corrected in the optical system, they affect single-aperture and multi-aperture systems in the same way. Because the focal length is still and the aperture diameter is still , remains the same and . As the total amount of pixels in the system does not change, . In summary, both segmenting and supersampling multi-aperture systems collect the same amount of light as single-aperture systems, as long as the -number and the total photodetector area are kept constant. 3.2.SharpnessIn this section, we will first examine the effects of supersampling on image sharpness. Segmentation of the FOV will be of relevance in the course of the discussion. By using supersampling, a digital camera can be made thinner without sacrificing sampling rate in object space and without requiring a smaller pixel pitch. To retain actual optical resolution in object space along with sampling rate, however, the MTF of the channels in image space has to keep up with the sampling rate. Supersampling multiplies the image plane sampling frequency and the Nyquist frequency by a factor of . Therefore, the MTF should now show significant modulation up to . Consequently, it has to improve considerably. The MTF of a camera is the product of the MTF of the lens and the sensor, where the sensor MTF consists of a geometrical component and a component resulting from crosstalk between pixels: describes spatial integration over the photodetector. For square photosites, it is the Fourier transform of the rect function with the width of the photosensitive area : The pixel pitch stays the same. While we are still free to choose a smaller , light sensitivity decreases with photosensitive area, or . Therefore, we assume to be constant. Crosstalk depends on the chief ray angle of light incident on the sensor and on sensor technology. Neither of them changes for multi-aperture systems. Therefore, is constant as well. The burden of improving the system MTF is therefore placed entirely on the optical MTF. As described by Lohmann,13 if an optical system is scaled by the factor , the area of an image point scales as for light of the wavelength and with aperture stop number and the lateral aberration ( is its Gaussian moment).When diffraction is neglegible, the diameter of an image point is and the resolution limit therefore scales linearly with the size of the system. Supersampling with scales each individual optical channel of the multi-aperture system by . Point diameters are therefore scaled by .Segmenting the FOV also has beneficial effects. Many of the Seidel aberrations depend on field height .12 Field curvature and astigmatism, for example, increase with . Therefore, segmenting the FOV into parts reduces aberrations accordingly. However, quantifying the benefit exactly is not possible so easily. The well-known scaling laws for Seidel aberrations only apply to imaging with a single lens. In practice, aberrations are partially corrected with multilens systems, whose behaviour is more complex. This is true even for low-cost mass-market cameras for mobile devices. With a certain amount of correction, higher-order aberrations cannot be neglected any more; these aberrations also defy description by simple scaling laws. In conclusion, optical MTF is indeed improved considerably by scaling. This is necessary to retain optical resolution in object space. As an example on how this works out, Fig. 4 shows the MTF of a system with aberrations () and the effect of scaling down this system (). First, only optical MTF is plotted on an absolute frequency axis (a). Optical MTF is improved as expected for increasing . However, when the axis is normalized to the sampling frequency , which scales with , improvement is less apparent (b). When we include pixel MTF, system MTF is similar for all (c). Therefore, object-space sharpness of the supersampled systems is comparable to the original system. Increasing further still improves optical MTF, but pixel MTF cancels this gain. Fig. 4Scaling effects for a system with two optical surfaces and , F2.4, simulated on-axis MTF curves. (a) Optical MTF improves for scaling the optical system down. Supersampling factors to 3; is the original system. Plotted on absolute frequency axis (cycles/mm). (b) The same curves plotted on a frequency axis relative to the image-space sampling frequency , which scales with . (c) Optical MTF multiplied with geometrical pixel MTF. (d) Improvement in optical MTF is limited by diffraction effects, shown by scaling the system down by a factor of 4.  Enhancement to the optical MTF itself is limited by diffraction, which is independent of system scaling. This is illustrated in Fig. 4(d). Here, we used the same optical system as in Fig. 4(a), but scaled it down by 4, so is now 1 mm. Again, optical MTF is improved for , but improvement is limited by diffraction (dashed line). The resulting object space sharpness for is lower than the sharpness of the original system. 3.3.Manufacturing TolerancesWhen manufacturing a lens system, deviations in lens curvatures, distances, decenter and tilt degrade the system performance. When scaling a lens system down, deviations have to be smaller as well, or performance is compromised. As a simple example, consider a single thin lens with focal length and diameter positioned so that it focuses light from point onto an image plane (Fig. 5). When the lens is moved from its correct image plane distance by a deviation , defocus leads to an image point diameter . The smaller the system, the smaller has to be to retain sharpness. Accordingly, has to be smaller as well. Fig. 5Image point diameter of a defocused optical system with focal length and lens diameter , with the image plane moved by . 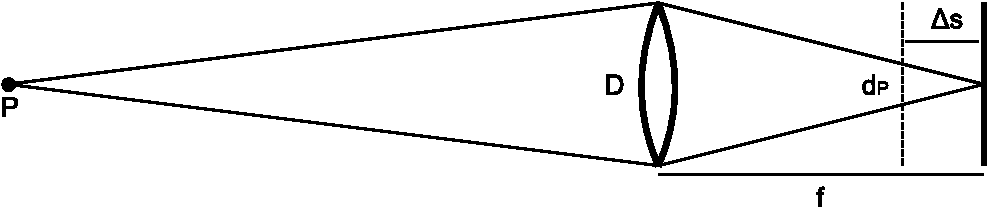 The same is true for the focal length of the lens: For a plano-convex lens, is proportional to lens radius ,12 so a deviation leads to a new focal length with . effectively is a defocus shift , leading to an image point diameter analogous to a lens shift. For perspective, with current pixel technology, is desirable. This requires a focus shift of less than . The ability to meet the required tolerances depends on the technology that is used to manufacture and assemble the lens components. A suitable technology for multi-aperture systems is wafer-level optics (WLO), as multiple lenses side by side are manufactured and aligned in parallel. Assembly of the lens components can be achieved with the required micron precision.14 Critical, however, is precision during replication of the lens components. Lenses are manufactured from certain polymers by molding and ultraviolet curing. During hardening, these materials shrink significantly. The amount of shrink is proportional to the lens volume. Lens volume grows with the square of the lens radius and linearly with lens sag. Therefore, small lenses with low sags are preferable. Molding tools are adjusted to anticipate shrink; however, shrink has a certain spread that is proportional to shrink itself. The hardened lenses therefore still have form deviations that scale with . Using a multi-aperture architecture—either supersampling or segmenting—decreases lens diameters. For a supersampling factor of , lens diameter decreases by , lens sag also decreases by and we can expect deviations to decrease with the cube of . Segmenting the FOV also reduces lens diameters, having a similar effect on deviations. In conclusion, while tolerances have to be tighter for scaled-down lens systems, the fact that small lenses can be manufactured with less shrink makes it easier to meet these tolerances. Therefore, sharpness of actual, mass-manufactured camera systems can benefit significantly from a multi-aperture architecture. This result contradicts the theoretical analysis in Sec. 3.2, which suggested that multi-aperture systems can at best reach a performance comparable to single-aperture systems. 3.4.VolumeWe already established that system thickness is reduced by supersampling. In some applications, however, total system volume is more relevant than thickness. Therefore, we now examine how multi-aperture system volume compares to that of a single-aperture system . We again treat the two different architectures (supersampling and segmented FOV) separately. In both cases, we first derive the footprint of the system. It is given by either sensor footprint or total aperture area , depending on which one is larger. In the single-aperture case, is simply the area of the single system aperture. The values for the multi-aperture system are and , which is now the sum of all individual aperture areas . Next, we derive system height. In both cases, system height scales with effective focal length . To , a part of the optical system thickness is added, depending on system complexity and placement of the principal planes. We disregard the thickness of the image sensor, sensor carrier and casing, as these values are small compared to the focal length and are not affected by the system architecture. Supersampling: As noted in Sec. 3.1, neither the pixel pitch nor the total number of pixels on the sensor change. Therefore, . This is also true for : assuming circular apertures with diameter . Therefore, system footprint stays the same. , in contrast, is reduced by a factor of . As the lens dimensions all scale with , . Therefore, and . In conclusion, a supersampling system is not only thinner, but also has less volume than a single-aperture system.Segmentation of FOV: Again, pixel size and number stay the same, so . However, the single-aperture with area is now replaced with copies of the original aperture. Aperture area therefore is increased: The proportion of to in a camera is approximately the proportion of the corresponding lengths: Miniaturized cameras tend to have a large FOV. If we assume and , . Therefore, the sensor width is larger than the lens diameter and system footprint is given by for . Effective focal length is not affected. Reduced optical system complexity in each channel, however, decreases slightly. Therefore, system volume is smaller than for moderate segmentation of FOV, but increases with for large . This analysis does not consider additional volume consumed by the system casing, structures for suppressing stray light or walls separating channels. The latter are needed to prevent crosstalk between channels. In current systems such as the eCLEY, structures for crosstalk suppression do consume a considerable amount of space between channels. They therefore increase the total volume of the system and lead to unused areas on the image sensor. For reducing this waste of space and sensor area, very thin vertical or slanted walls have to be manufactured. Techniques for cheaply fabricating these structures are currently being developed. 4.ReconstructionIn the last section, the theoretical and practical scaling characteristics of multi-aperture systems were discussed. In the next section, these characteristics are verified with measurements. To compare the analysis with the measurements, we have to consider that in a multi-aperture system, a multitude of images have to be combined into a continuous image. This image reconstruction step has effects on image sharpness and alters the noise characteristics of the system. In principle, neither can be improved without negatively affecting the other. As the focus of this publication lies on the scaling characteristics of multi-aperture systems per se, we do not attempt an exhaustive analysis of this topic. Instead, we quantify the effects of a single, simple reconstruction scheme, a shift-and-add algorithm with Gaussian interpolation. In this case, the effect is a decrease in noise and a loss in sharpness. 4.1.AlgorithmWe treat each recorded pixel as a measurement of the light incident on the camera from a specific direction. The pixel viewing directions are derived from the model of the optical system; it includes effects such as geometric distortion. We intersect each of these pixel viewing rays with a virtual focal plane (Fig. 6). The intersection points of viewing rays and focal plane form a two-dimensional cloud of measurements, an irregular sampling of the scene (irregular because of parallax and geometric distortion of the channels; Fig. 7). To render an image from this point cloud, we create a regular sampling of the scene by interpolation. For each pixel of the target image, contributions from the nearest measurement points available are added, weighted with the distance from the measurement coordinate to the target pixel (Fig. 8). Fig. 6Viewing directions of the pixels of one channel of a multi-aperture system (arrows), intersected with a virtual focal plane (points). The points show how this channel samples object space on a specific focal plane.  Fig. 7Placing the measurement of multiple channels (four in this case, shown in different colors) on a common focal plane according to the distances of channels and focal plane creates an irregular point cloud. 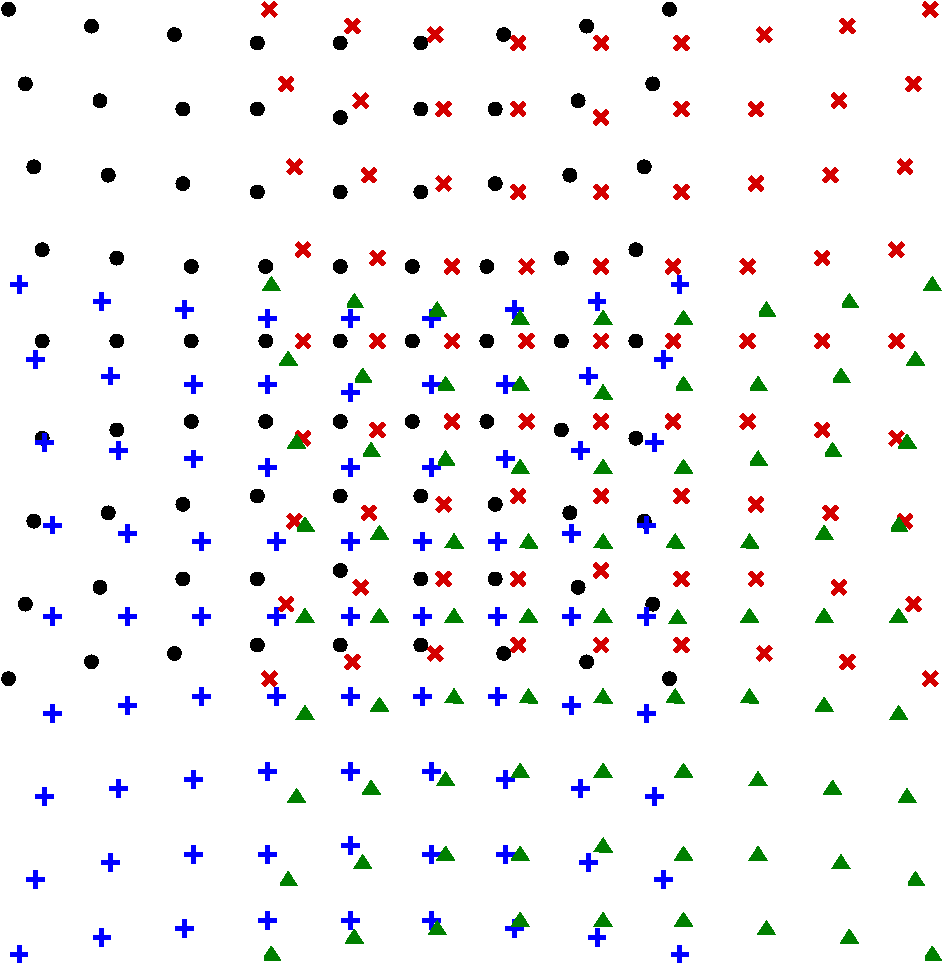 Fig. 8To render an image from an irregular point cloud, a regular grid is overlaid on the point cloud. Each of the grid intersections represents a target pixel in the image. Each of the target pixels (black) is calculated by interpolating the nearest measurements from the point cloud (grey).  From the distance , the weight of the neighbor , contributing to the target pixel at coordinates and , is calculated as where is an adjustable filter width. The weights are normalized so that .The algorithm is presented in full in Ref. 11. 4.2.SharpnessInterpolation can be treated as a spatial filter. Calculating the Fourier transform of the filter kernel yields the MTF of the interpolation operation. The interpolation kernel is the continuous version of Eq. (2), the Gaussian again with the filter width and the distance from target pixel to measurement coordinate , in units of pixels. The effect is a loss in modulation at higher frequencies.4.3.NoiseEach target pixel is calculated from the weighted mean of measurements. If a value is calculated as the weighted sum of measurements with equal uncertainties , with the weights . The weights are different for each target pixel. They depend on the distance of the measurement to the target pixel and on the filter width .For the following analysis, we first assume uniform density of measurements. In one extreme case, the target pixel is exactly on top of a single source pixel. Choosing a filter width of and setting in Eq. (2), (not normalized yet). Four other pixels are at the distance of pixel, yielding . Four further pixels are at a distance of , yielding . Normalizing yields contributions of , 0.08 and 0.01, respectively. Noise is consequently reduced by a factor of . In the other extreme, the target pixel is exactly between four source pixels, each contributing equally. No other pixels contribute significantly due to their large distance. Noise is decreased by . In conclusion, noise is decreased by a factor of about 1.54 to 2. 5.ResultsIn this section, to support the conclusions of the last section, we compare one state-of-the-art single-aperture WLO camera, the OmniVision CameraCube, with a WLO multi-aperture system, the eCLEY. To verify sharpness, we directly compare the MTF of these systems. Direct comparison of the sensitivity of the two cameras is not useful, as they employ different sensors with different pixel pitches (1.75 μm versus 3.2 μm). The route taken is described next. 5.1.SensitivityAccording to theory, the eCLEY should have the same sensitivity as a single-aperture camera with the same aperture F3.7. For verification, we took an image of a uniformly lit target with the image sensor used in the eCLEY, with a single-aperture 16-mm lens (Schneider Cinegon) attached and set to F3.7. The same target was also recorded with an eCLEY. To avoid linearity issues, the exposure time was adjusted so that both cameras recorded roughly the same mean value (DN) on the target area. The values recorded and the corresponding exposure times were:
The longer exposure time for the eCLEY suggests a lower sensitivity (by a factor of 0.77). We suspected that this discrepancy is caused by the way the eCLEY objective is attached to the sensor. The clear epoxy filling the gap between objective and substrate has a refractive index close to that of the per-pixel microlenses on the sensor, thereby rendering them ineffective. We validated our suspicion by attaching a plane glass to one half of the sensor, again filling the air gap with epoxy. We then recorded the same target area with the treated sensor, again imaging the target area with the Cinegon lens set to F3.7. We measured values of 140 on the sensor half without plane glass and 110 on the other half, yielding a relative sensitivity . This figure also gives us an estimate on the relative area of the photosensor on each pixel. We assume a perfect efficiency of the pixel microlenses and set the fill factor of the sensor pixels to . Sensitivity of the eCLEY consequently has to be adjusted by a factor of 1.40, yielding an adjusted relative sensitivity of about , higher than the single-aperture lens. The new discrepancy is most likely caused by losses due to internal reflections in the Cinegon lens, which has more air-glass surfaces than the eCLEY objective. Note that the loss in sensitivity due to the loss of the per-pixel microlenses is not inherent to multi-aperture systems or WLO. The attenuation can be avoided by replacing the bottom substrate with a spacer layer that introduces an air gap between optics module and sensor. 5.2.NoiseAs illustrated in Sec. 4.3, the reconstruction scheme that we use interpolates measurements, which should reduce noise. To verify this claim, we first established the image noise of the sensor used in the eCLEY. To this end, we recorded 100 images of a scene with a wide dynamic range, using the eCLEY. The recorded images contain microlens images with all values in the dynamic range of the camera, from 0 to 255. As we are interested in temporal noise, we evaluated the temporal behaviour of each pixel. For each of them, the mean and the standard deviation were calculated. Pixels were then distributed into bins of integer values according to their mean. The resulting distribution of standard deviation over image signal is plotted on a log-log scale in Fig. 9. Fig. 9Temporal pixel noise (standard deviation) of the sensor in the eCLEY, unprocessed microlens image and reconstructed image (processing filter width ). 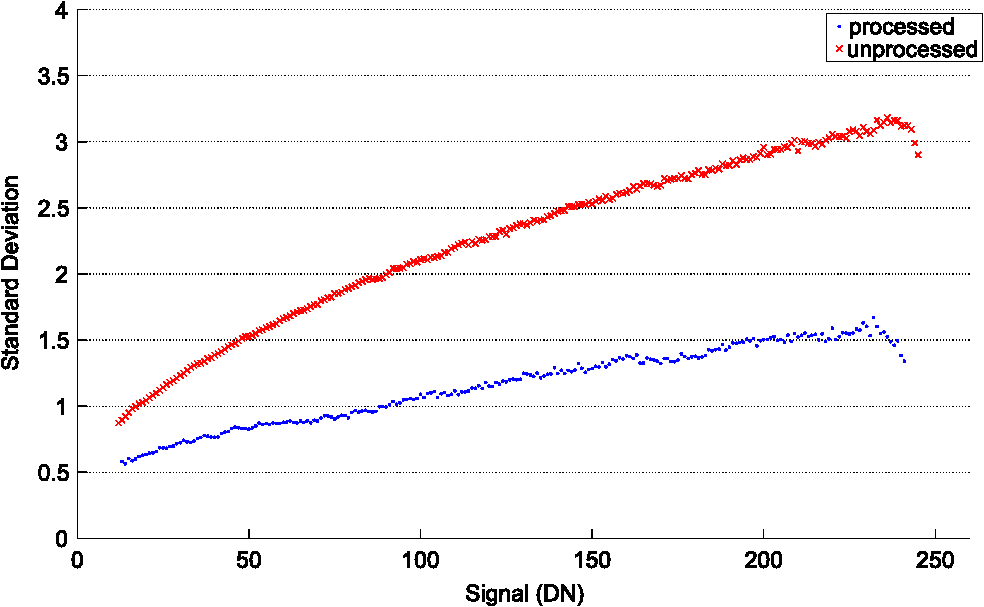 We proceeded to process each of the recorded images with our reconstruction algorithm, creating continuous images from the raw images. Filter width was set to 2.0. These processed frames were characterised pixel by pixel as before, yielding another distribution of standard deviations, this time including reconstruction. This distribution is also plotted in Fig. 9. Comparing the plots shows that noise is attenuated by a factor of 2.0, being at the top end of our prediction from Sec. 4.3 and validating our model of the reconstruction algorithm. 5.3.SharpnessWith the results from the previous Secs. 5.1 and 5.2, we have a complete model of the eCLEY transfer function. Figure 10 shows simulations of all components. On top, the diffraction limit for F3.7 is plotted. The optical MTF of the eCLEY central channel is quite close to this limit. It is calculated from a ZEMAX model of the eCLEY objective lens. Fig. 10MTF of the eCLEY. From the diffraction limit downwards, one additional component is added to the simulation for each curve. The complete system MTF is plotted at the bottom, with measurements confirming the model at several steps.  Next, the contribution of the sensor is multiplied with the optical MTF. From Sec. 5.1, we assume square photodiodes with a width of . The crosstalk was modeled as a Gaussian and fitted to results from Refs. 15 and 16. Finally, the reconstruction step is considered by multiplying the filter kernel to optical and sensor MTF, with filter width . To validate this model, we measured three steps of the image formation process: The optical MTF of a single eCLEY channel, the MTF of a single channel including sensor and the MTF of the complete system, including reconstruction. Each measurement was carried out with the slanted-edge method.17 The measurements (also plotted in Fig. 10) match the predicted MTFs quite closely, validating our model of the eCLEY. In summary, we have shown that
Note that no calibration was necessary to align the microlens images in the reconstruction step. The distributions of the pixels on the virtual focal plane were taken directly from the ZEMAX model. This fact demonstrates the manufacturing and alignment precision of the microlens array. Finally, we compared the MTFs of the eCLEY and an OmniVision CameraCube. Figure 11 shows the complete system MTF of both systems. We normalized the frequency axis on the image-space sampling frequency of each camera, which is for the CameraCube and for the eCLEY. The eCLEY exhibits comparable sharpness at reduced total track length. Fig. 11MTF of OmniVision CameraCube and eCLEY. System MTFs plotted relative to the sampling frequency of each system.  Figure 12 compares two shots of an USAF test target recorded with the eCLEY and the CameraCube. These photographs also demonstrate similar sharpness for both systems. 5.4.VolumeDespite having a larger pixel pitch (3.2 μm instead of 1.75 μm), the eCLEY has a shorter track length than the CameraCube (1.4 mm instead of approximately 2.2 mm). This is the result of supersampling in the eCLEY (, in and ), which cuts total track length in half. Additionally, the eCLEY has only one optical surface per channel instead of the two surfaces of the CameraCube,18 which also reduces thickness. Footprint, on the other hand, is larger for the eCLEY, being compared to . This increase in footprint is partly due to the larger pixel pitch, partly a result of the segmentation of the FOV (, in and ), as deduced in Sec. 3.4. 6.ConclusionWe provided an analysis of the sensitivity, resolution and volume of two types of multi-aperture systems. Compared to single-aperture cameras, systems which supersample object space significantly reduce volume at constant sensitivity. Matching the resolution is challenging, but possible for low supersampling factors in cases where the optical system is not diffraction limited. Systems that segment the FOV increase footprint and volume, but simplify the optical system, which helps reducing track length. Both principles can be used in tandem to design cameras with lower track length and sufficient sharpness, as demonstrated with our measurements of the eCLEY. In this analysis, we assumed monochrome sensors without color filter arrays (CFAs). For a sensor with CFA, the color channels are traditionally undersampled, potentially leading to aliasing. This is a favorable premise for a supersampling multi-aperture system: with , aliasing can be avoided and, at the same time, track length can be halved. Extending the discussion of this publication to color systems therefore is a promising direction. Finally, plenoptic cameras are in essence also multi-aperture systems. In the focused plenoptic camera, multiple channels view overlapping parts of an intermediate, demagnified image of the subject. Each channel has a limited field of view; the sampling patterns of the channels are interleaved so that the intermediate image is supersampled. This translates into increased resolution, however, only when the combined MTF of objective lens, microlens array and sensor is sufficiently large. In multi-aperture and plenoptic cameras, filtering can regain sharpness at the price of increased noise. This is traditionally the subject of superresolution algorithms. Work in this area has focused on aligning the multiple views of the subject accurately and robustly, with the required sub-pixel resolution. When the optical system is manufactured with sub-micron precision, good alignment can be already be achieved from the geometry of the design. Similarly, the transfer function can be simulated with useful precision. To examine whether the available data is sufficient to increase sharpness without introducing artifacts would be another interesting topic. ReferencesM. W. Haney,
“Performance scaling in flat imagers,”
Appl. Opt., 45
(13), 2901
–2910
(2006). http://dx.doi.org/10.1364/AO.45.002901 APOPAI 0003-6935 Google Scholar
A. Brückneret al.,
“Thin wafer-level camera lenses inspired by insect compound eyes,”
Opt. Express, 18
(24), 24379
–24394
(2010). http://dx.doi.org/10.1364/OE.18.024379 OPEXFF 1094-4087 Google Scholar
J. Tanidaet al.,
“Thin observation module by bound optics (TOMBO): concept and experimental verification,”
Appl. Opt., 40
(11), 1806
–1813
(2001). http://dx.doi.org/10.1364/AO.40.001806 APOPAI 0003-6935 Google Scholar
A. Portnoyet al.,
“Design and characterization of thin multiple aperture infrared cameras,”
Appl. Opt., 48
(11), 2115
–2126
(2009). http://dx.doi.org/10.1364/AO.48.002115 APOPAI 0003-6935 Google Scholar
V. Vaishet al.,
“Using plane parallax for calibrating dense camera arrays,”
in Proc. IEEE Comput. Soc. Conf. Comput. Vis. Pattern Recognit.,
I-2
–I-9
(2004). Google Scholar
S. C. ParkM. K. ParkM. G. Kang,
“Super-resolution image reconstruction: a technical overview,”
IEEE Signal Process. Mag., 20
(3), 21
–36
(2003). http://dx.doi.org/10.1109/MSP.2003.1203207 ISPRE6 1053-5888 Google Scholar
K. Nittaet al.,
“Image reconstruction for thin observation module by bound optics by using the iterative backprojection method,”
Appl. Opt., 45
(13), 2893
–2900
(2006). http://dx.doi.org/10.1364/AO.45.002893 APOPAI 0003-6935 Google Scholar
A. V. Kanaevet al.,
“TOMBO sensor with scene-independent superresolution processing,”
Opt. Lett., 32
(19), 2855
–2857
(2007). http://dx.doi.org/10.1364/OL.32.002855 OPLEDP 0146-9592 Google Scholar
A. V. Kanaevet al.,
“Analysis and application of multiframe superresolution processing for conventional imaging systems and lenslet arrays,”
Appl. Opt., 46
(20), 4320
–4328
(2007). http://dx.doi.org/10.1364/AO.46.004320 APOPAI 0003-6935 Google Scholar
Y. Kitamuraet al.,
“Reconstruction of a high-resolution image on a compound-eye image-capturing system,”
Appl. Opt., 43
(8), 1719
–1727
(2004). http://dx.doi.org/10.1364/AO.43.001719 APOPAI 0003-6935 Google Scholar
A. Oberdörsteret al.,
“Correcting distortion and braiding of micro-images from multi-aperture imaging systems,”
Proc. SPIE, 7875 78750B
(2011). http://dx.doi.org/10.1117/12.876658 PSISDG 0277-786X Google Scholar
W. J. Smith, Modern Optical Engineering: The Design of Optical Systems, McGraw-Hill, New York
(1990). Google Scholar
A. W. Lohmann,
“Scaling laws for lens systems,”
Appl. Opt., 28
(23), 4996
–4998
(1989). http://dx.doi.org/10.1364/AO.28.004996 APOPAI 0003-6935 Google Scholar
R. Völkelet al.,
“Technology trends of microlens imprint lithography and wafer level cameras (WLC),”
in Conf. Micro-Optics,
(2008). Google Scholar
J. Chenet al.,
“Imaging sensor modulation transfer function estimation,”
in Proc. 17th IEEE Int. Conf. Image Process.,
533
–536
(2010). Google Scholar
X. Jinet al.,
“Sensitivity and crosstalk study of the zero gap microlens used in 3.2 μm active pixel image sensors,”
Microelectron. Eng., 87
(4), 631
–634
(2010). http://dx.doi.org/10.1016/j.mee.2009.08.028 MIENEF 0167-9317 Google Scholar
S. E. ReichenbachS. K. ParkR. Narayanswarmy,
“Characterizing digital image acquisition devices,”
Opt. Eng., 30
(2), 170
–177
(1991). http://dx.doi.org/10.1117/12.55783 OPEGAR 0091-3286 Google Scholar
R. Fraux,
“Omnivision’s VGA wafer-level camera,”
3D Packaging, 22 26
–27
(2012). Google Scholar
BiographyAlexander Oberdörster is a researcher at the Fraunhofer Institute for optics and precision engineering in Jena, Germany. He graduated in physics from the University of Düsseldorf and the Fraunhofer ISE in Freiburg. At the ISE and at Spheron VR AG, he studied and designed devices for measuring optical scattering properties of surfaces (BRDFs). Moving on to the Fraunhofer IIS in Erlangen, he developed cameras for digital cinematography and related technologies. Currently, he is working on image processing algorithms for multi-aperture imaging systems. His research interests include computational photography, non-uniform sampling and reconstruction and the measurement of light fields. Hendrik P. A. Lensch holds the chair for computer graphics at Tübingen University. He received his diploma in computer science from the University of Erlangen, in 1999. He worked as a research associate at the computer graphics group at the Max-Planck-Institut für Informatik in Saarbrücken, Germany, and received his PhD from Saarland University, in 2003. He spent two years (2004 to 2006) as a visiting assistant professor at Stanford University, USA, followed by a stay at the MPI Informatik as the head of an independent research group. From 2009 to 2011, he was a full professor at the Institute for Media Informatics at Ulm University, Germany. In his career, he received the Eurographics Young Researcher Award 2005, was awarded an Emmy-Noether-Fellowship by the German Research Foundation (DFG) in 2007 and received an NVIDIA Professor Partnership Award in 2010. His research interests include 3-D appearance acquisition, computational photography, global illumination and image-based rendering, and massively parallel programming. |


