|
|
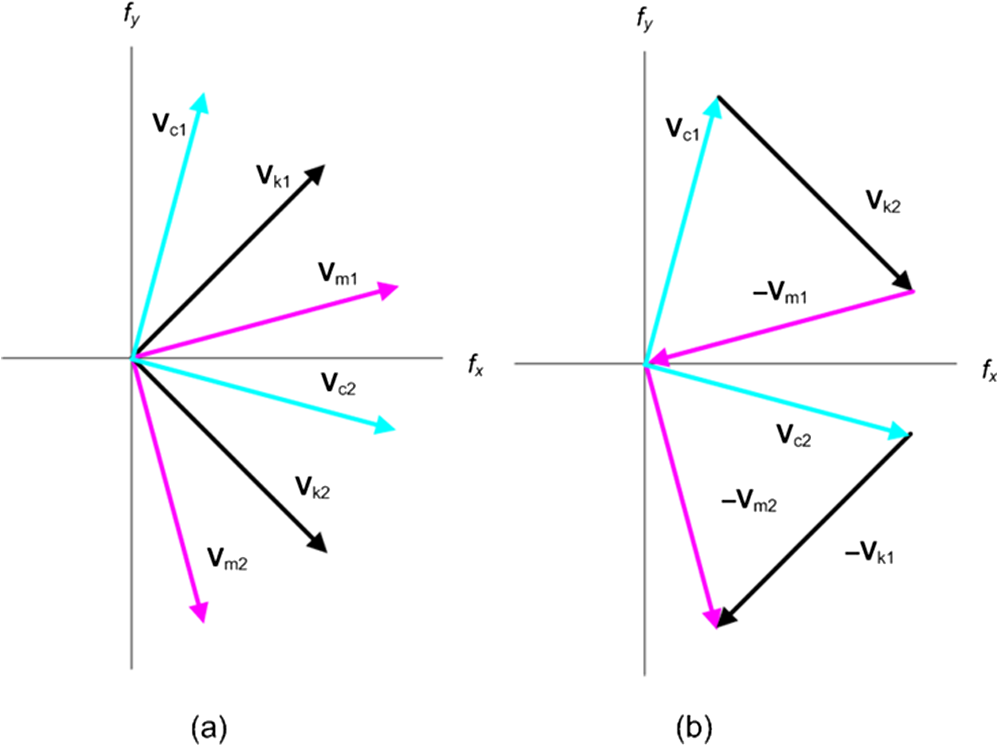
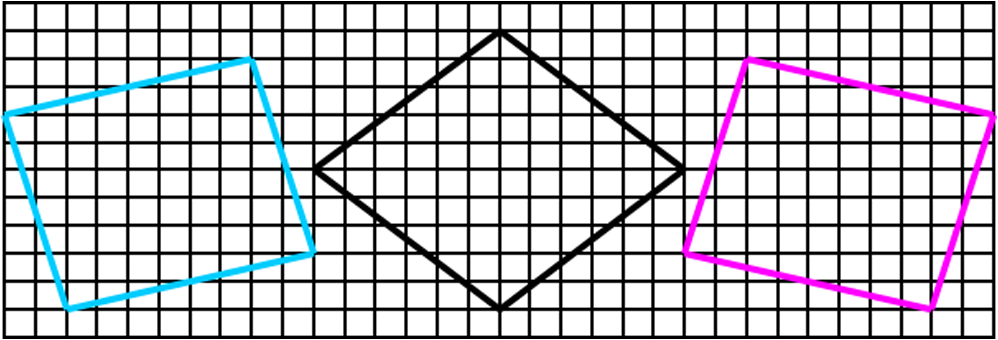
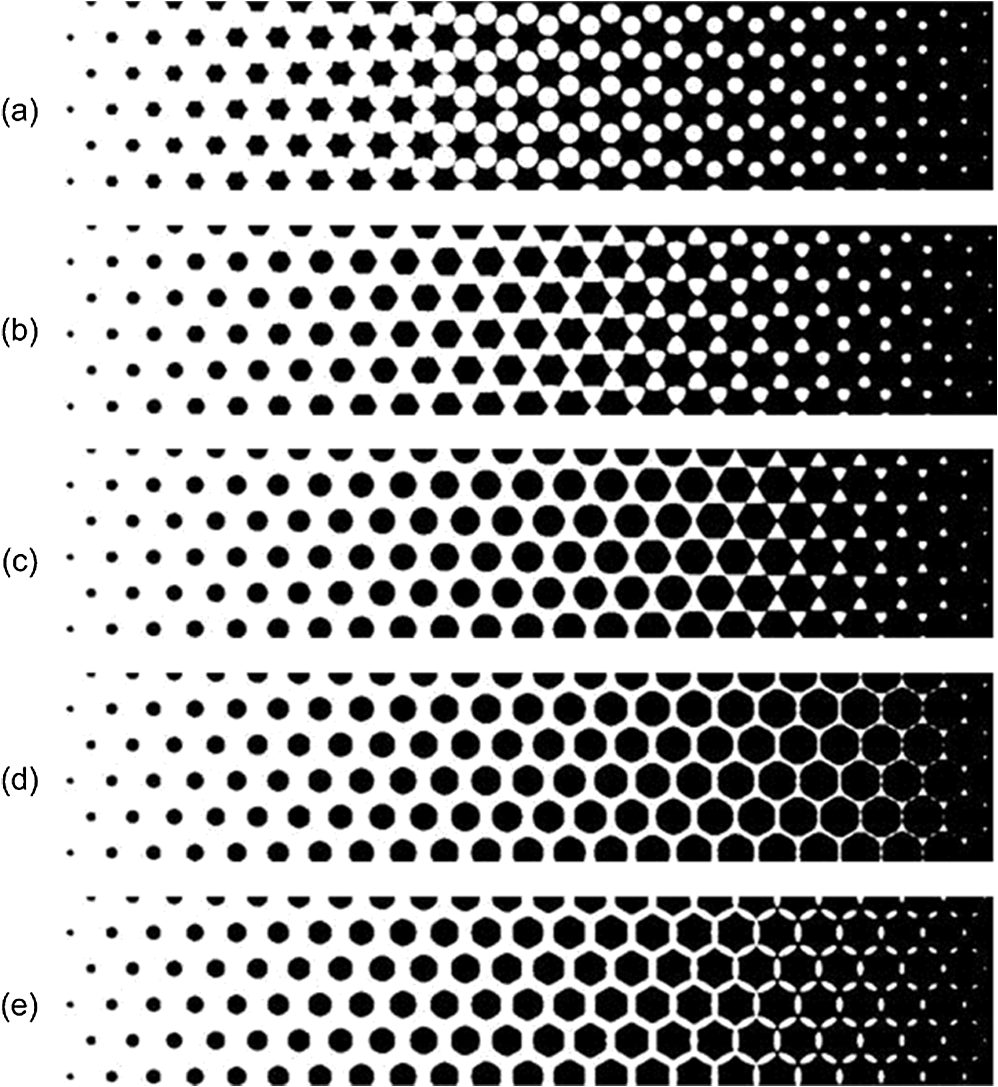
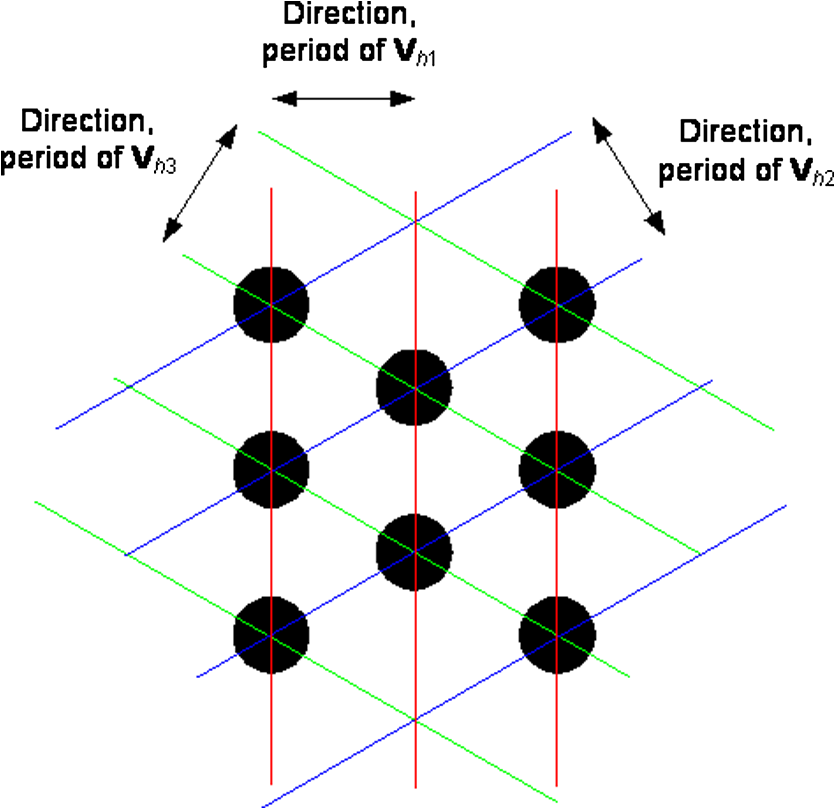
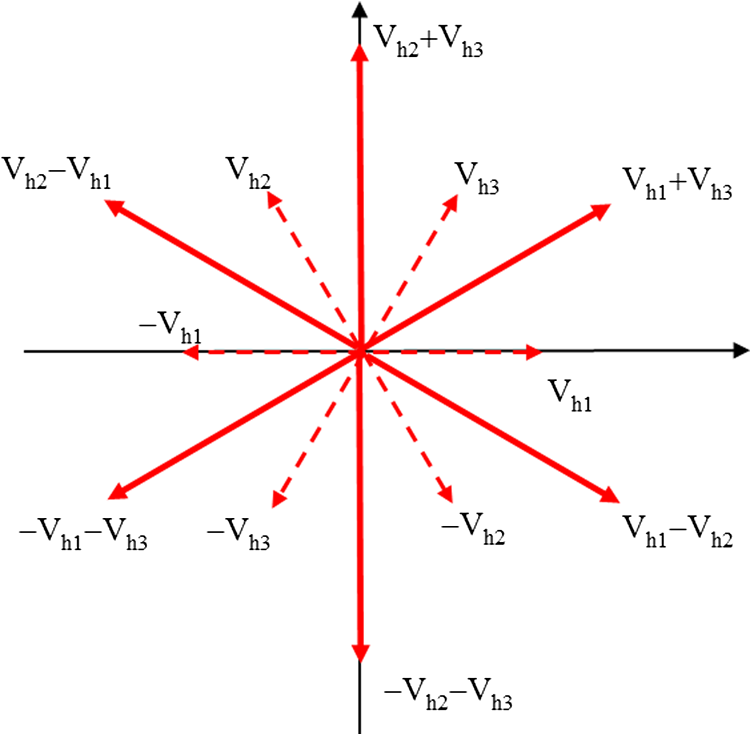
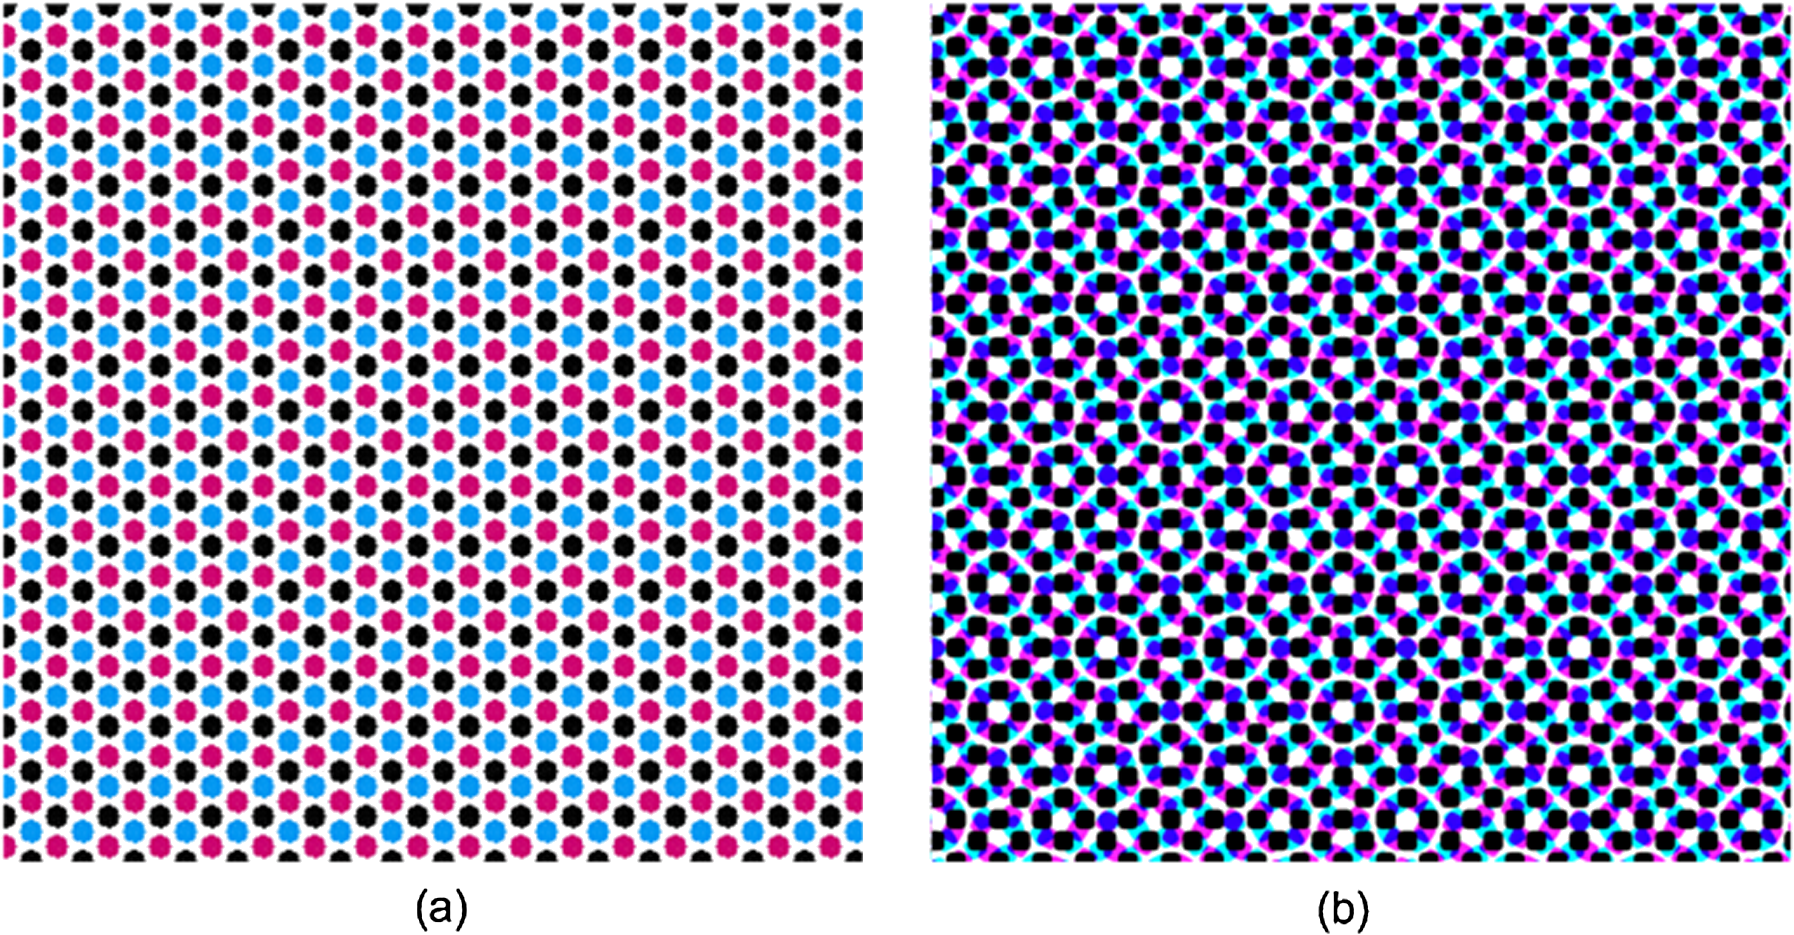
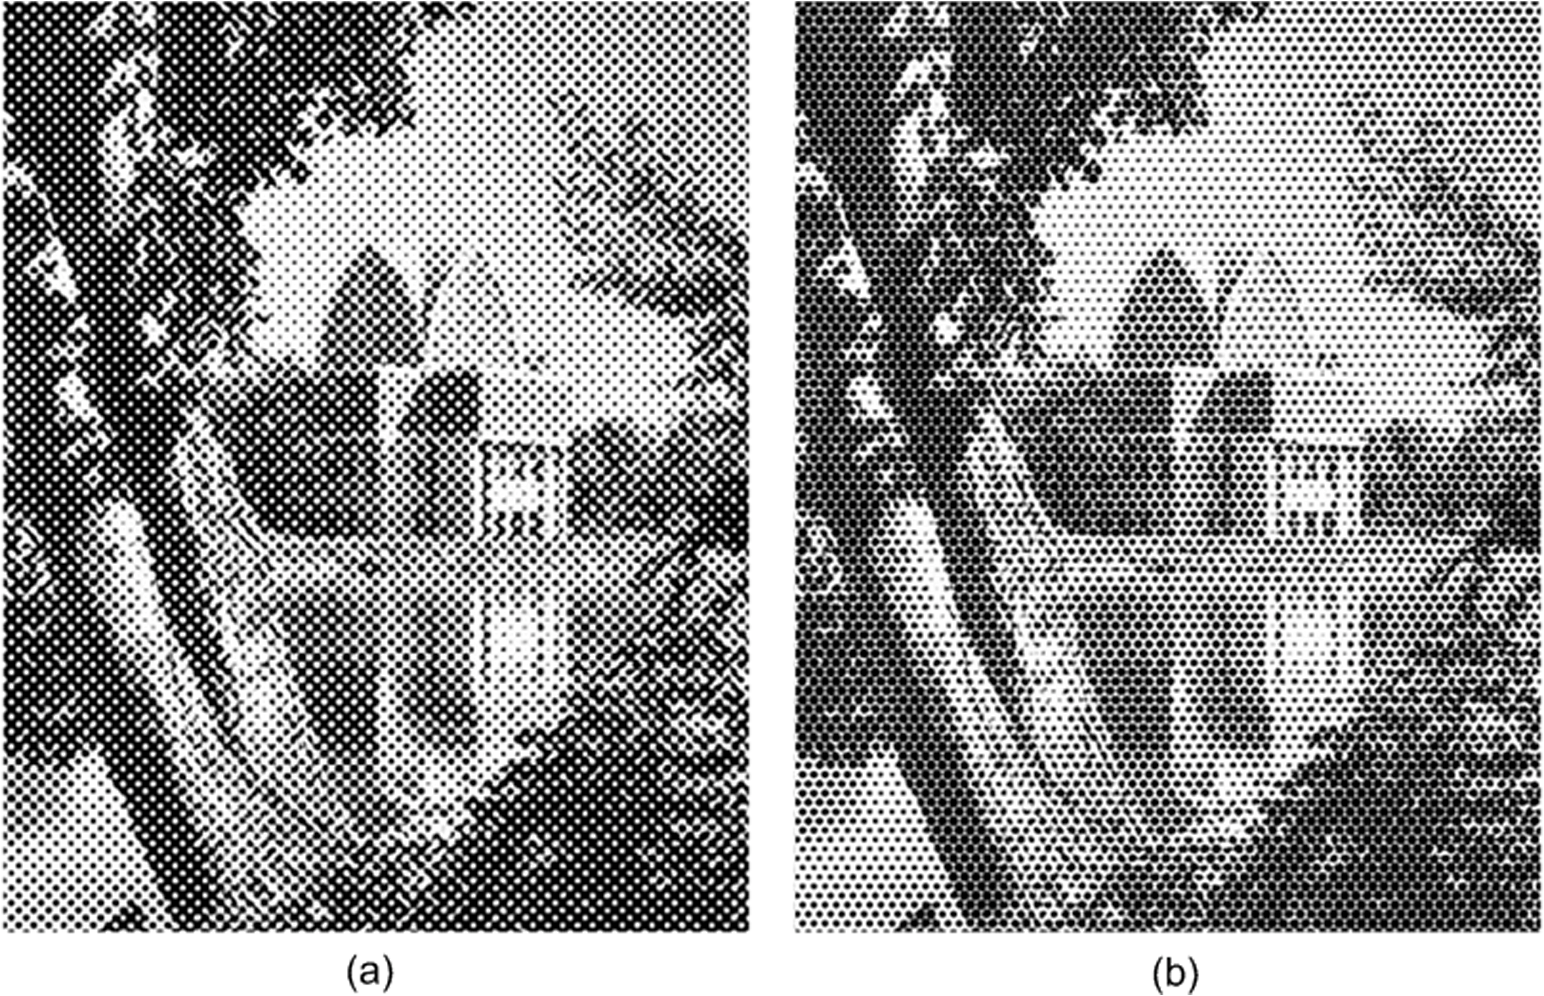
1.IntroductionHexagons are widely observed as a packing or tiling geometry in nature, yet they appear to have been avoided in conventional halftone tiling. A goal of the present study is to understand the potential barriers that have prevented their use and present new halftone geometry options that overcome the issues while offering several potential benefits. Most digital color printers operate in a binary mode, where for each color separation, a given pixel is written as a colored spot or it is not written. The human visual system provides the illusion of continuous color tones by spatial averaging of the printed colored spots and intermediate space. Digital halftoning controls the printing of the colored spots and therefore defines the appearance of the halftone output. A common halftone method is screening, which compares requested continuous tone levels of a colorant to predetermined thresholds typically defined over a square cell that is tiled to fill the image plane. The output of screening is a binary pattern of multiple small spots, which are regularly spaced as determined by the addressability of the imaging system. Marking processes such as electrophotography and offset printing typically cluster the small spots within a cell because the larger clustered mass prints with more consistent size and density than spots printed with isolated pixels. The alignment of the clusters in the tiling defines the geometry of the halftone screen. The resulting halftone structure is a two-dimensionally periodic pattern, possessing two fundamental spatial frequencies determined by the geometry of the halftone screen. A common problem in digital color halftoning is the potential manifestation of moiré patterns. Moiré is an undesirable interference pattern that can occur when two or more color halftone separations are printed in overlay. The interference occurs primarily due to the nonlinearity of color mixing of subtractive colorants, and suppression of printing one colorant by another colorant. As a result, low frequency components can be visibly evident as interference patterns in the halftone print. To avoid moiré and color shifts due to misalignment and misregistration, different halftone screens are typically used for different color separations, and the fundamental frequency vectors of the different halftone screens are separated by relatively large angles. The large angular separation produces a large frequency difference vector between any two fundamental frequencies of the different screens so that no visibly objectionable moiré patterns are produced. There is a classical screen combination that provides suitable angular separation for two-colorant printing and moiré-free three-colorant printing. This combination consists of three screens constructed by square halftone cells of identical scalar frequency with one screen each placed at 15, 45, and 75 deg.1 The difficulty in avoiding objectionable moiré between halftone screens is more challenging when considering that four colorants are used in most printing presses. The four colorants are typically cyan (), magenta (), black (), and yellow (). The classical deg screen configuration is commonly used for , , and , while the classical screening method for uses a screen at 0 deg and is 8% to 10% different in frequency than the other screens so that the moiré is relatively high frequency and low contrast.2 Other common solutions for have also been suboptimal, such as stochastic screens, which can be prone to noise and tone instability. The understanding of moiré becomes increasingly complicated, and moiré-free solutions more challenging, when you consider that clustered-dot halftoning produces binary patterns, which are rich in harmonics that can cause unacceptable interference for certain colorant combinations. Moiré within halftones has been studied extensively. One example is by Amidror et al.,3 in which a spectral model based on Fourier analysis was used to explain the moiré due to the superimposition of halftone screens. Amidror et al. further developed an algorithm for moiré minimization, which included minimization of moiré due to interference of high-order harmonics. However, most halftone screen designs, including the classical three-color moiré-free solution, only can satisfy the moiré-free condition for moiré between fundamental frequencies of two or three colors. They neglect subtle moiré patterns due to interaction of harmonics, and employ an unnecessary constraint of square or rectangular cells. Halftone designers consider many options to deliver a screen with desirable characteristics, such as smooth texture, textures that are compatible with the image subject matter, low noise, tone stability, and lack of moiré. The designer often must settle for less than desirable results due to physical constraints such as a digital pixel grid and due to goals that sometimes lead to conflicting design strategies. In this paper we propose a new option to halftone screen designers with several potential beneficial properties compared to conventional square-cell-based screens. We propose hexagonally tiled screens that can be produced with a conventional orthogonal pixel grid. Halftones with hexagonal shape clusters are visually pleasing4 and theoretically the most compact halftone structure. Hexagonal halftones have been discussed in several publications and patents5–7 but a frequency analysis and connection to moiré in color printing is lacking. The proposed screens can appear to have smoother texture, and avoid moiré between fundamental and harmonic frequencies. Due to differences in packing geometry and touch point geometry, hexagons have the potential to possess different tone reproduction characteristics, which may be favorable for some marking processes. A fourth screen (e.g., yellow) can be included moiré-free, thereby avoiding problems associated with suboptimal halftoning for yellow. We also present a corresponding parametrically controlled hexagonal halftone spot function that allows for optimization of dot touch points and provides compact growth. The optimized touch points can prevent a tone reproduction discontinuity, while the compact growth throughout the gray ranges ensures maximum stability. Additionally, we present a three-colorant dot-off-dot (DOD) halftone configuration using hexagonal geometry. The geometry is based on a hexagonal base screen, where the three colorants are printed with specific displacements of the screen. DOD screens are used to produce smoother textures than rotated dot screens when colorant-to-colorant registration can be held to very tight tolerance, thereby avoiding the need for registration insensitivity enabled by rotated screens. Two previous DOD halftone methods8,9 provided pleasing texture for two and fourcolorants but did not describe three-colorant DOD. Harrington10 taught a method that can perform DOD halftoning with an arbitrary number of colors but the dot growth is along a curve rather than according to a conventional spot function. 2.Background2.1.Frequency Representation of Periodic Halftone PatternsClustered-dot halftoning methods produce halftone images that possess periodic structures defined by the halftone screens. For the purposes of moiré analysis, these images can be described in the frequency domain by discrete components without regard to amplitude and phase. In this representation, a two-dimensional halftone for a single colorant x forms a frequency lattice defined by two generator vectors , . The generator vectors correspond to the two fundamental frequencies of the halftone. Linear combinations of the vectors form the full spectrum with all points (harmonics) located on the lattice defined by the generator vectors and no frequencies are lower than the fundamentals. Moiré analysis for conventional halftoning focuses on cyan (), magenta (), and black (). Yellow () is usually include in some suboptimal manner, which may or may not be fully acceptable depending upon the visibility of yellow and its interaction with the other colorants. The fundamental vector frequencies for , , and can be denoted by , , , , , and , respectively, where the subscripts 1 and 2 refer to positive and negative angles, respectively. Figure 1(a) illustrates the appearance for an overlay of , , , and halftone images based on a traditional configuration, with cyan at ; magenta at ; black at , and yellow at . The traditional configuration uses the same halftone screen for , , and , with square cells rotated to given angles. The combined halftone texture, often referred to as the rosette pattern, is not a simple repeated pattern and its Fourier representation is complicated. Figure 1(b) shows the frequency vector representation of the , , and screens, which is used below for the moiré analysis. Fig. 1(a) Superposition of cyan, magenta, yellow, and black halftones in a conventional configuration (single color area ) (b) Fourier representation of cyan, magenta, and black halftones. 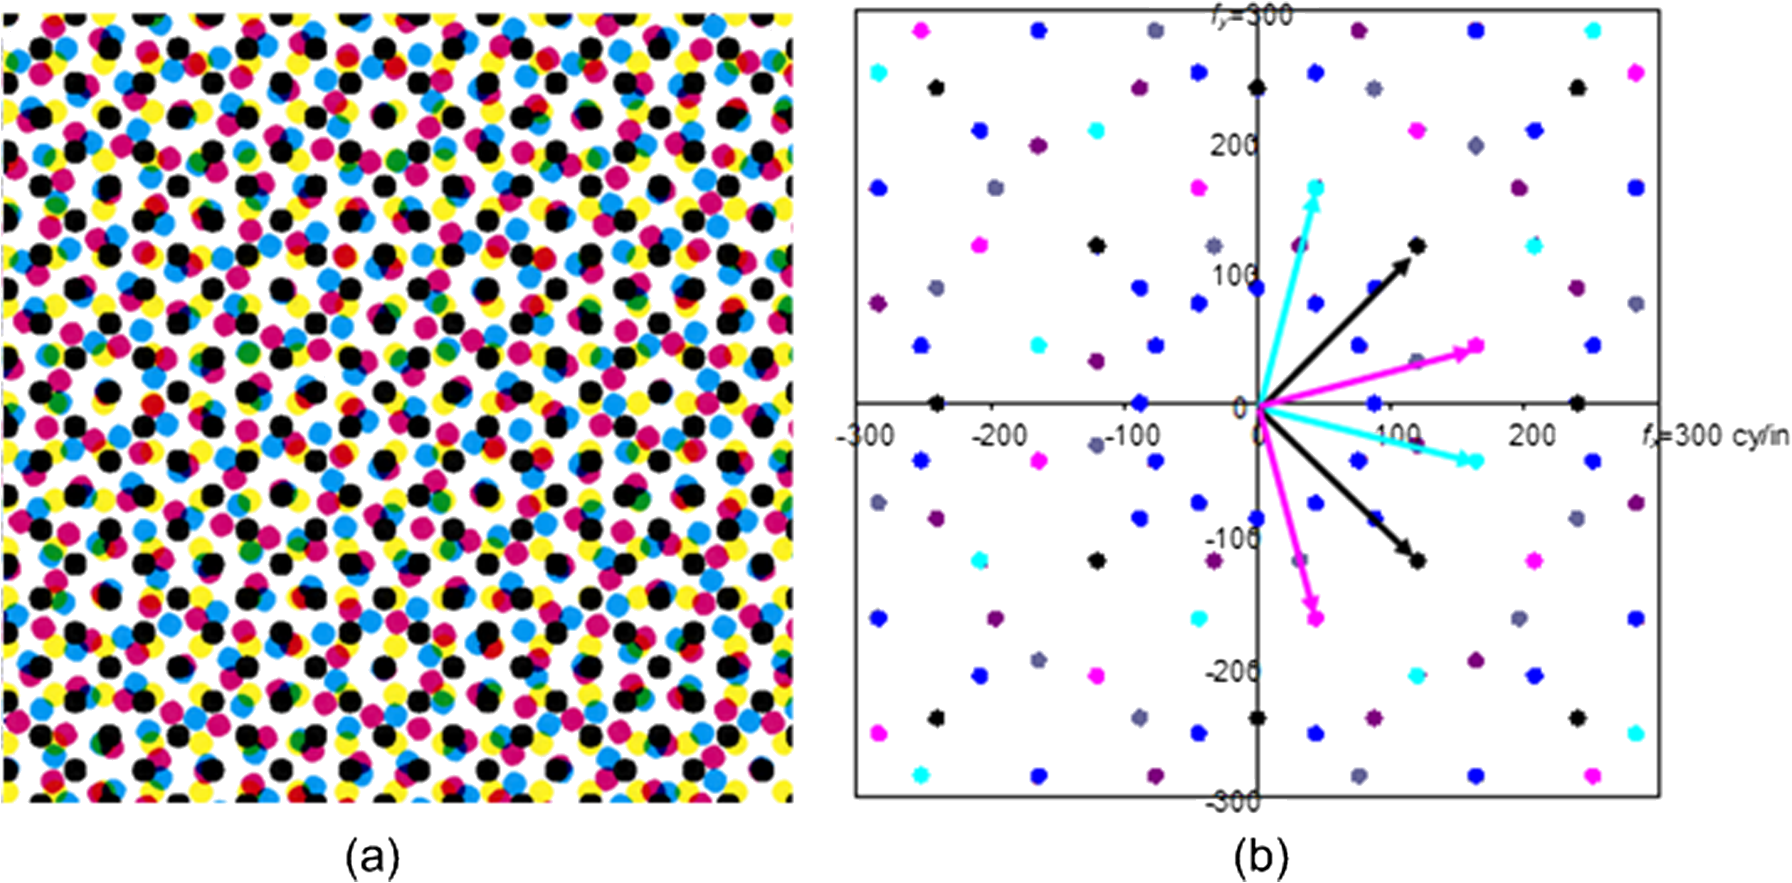 The Fourier transform is dominated by discrete frequency components shown as circular dots. The discrete components are defined by the two fundamental halftone frequencies for each screen, their two-dimensional higher-order harmonics (which can be considered to be linear combinations of the fundamentals), and linear combinations of components from different screens (which are beats, or forms of moiré). Note that amplitude and phase are not represented in these plots and also that there are many higher-order harmonics of the halftone frequencies that are not shown in the plots. The superposition of halftone color separations creates more frequency components than exist in the single separations of the various process colors. We can express the resultant vector frequency caused by superposition of two different colors as their frequency-vector difference, e.g., , where and are two frequency components from and , and Vcm is the difference vector. Since each Fourier component has its conjugate, i.e., there is always a frequency vector that represents the conjugate component of , the sign definition of frequency vectors is rather arbitrary. For each halftone screen, there are two fundamental frequency vectors, therefore, the color mixing of two screens for two different colors yields eight difference vectors by the fundamental frequencies alone. Considering other harmonics of the halftone frequencies, the combinations can yield a large number of difference vectors. 2.2.Moiré-Free ConditionsMultiple periodic phenomena can interfere to produce lower frequencies known as beats. In the field of halftoning, these beats appear as moiré. There are particular configurations of halftones that avoid creating objectionable moiré. The conventional moiré-free halftoning method utilizes screens for , , and , such that three-way combinations of their fundamental frequencies sum to zero frequency or very high frequencies. Typically, the screens are chosen to be composed of square cells, and the frequencies are chosen to be roughly equal with the angles separated by about 30 deg. A strategy to avoid two-color moiré is to ensure that no two-color difference vector due to fundamental halftone frequencies is too small.11 Using and halftones as an example, the two-color moiré-free condition can be summarized by where represents any one of , , , ; represents any one of , , , ; and is a frequency limit set around 50 to 70 cycles/inch to avoid visually objectionable moirés.It is well known that the most troublesome moiré is the three-color moiré that can appear in cyan-magenta-black prints produced by CMYK four-color printers.1 As an extension of the two-color case, one condition for three-color moiré-free printing can be summarized by where represents any one of , ; and is set similar to the two-color case.Unless the halftone frequencies are very high, say cycles/inch, it is very difficult to design halftone screens such that all three-color difference vectors, as well as all two-color difference vectors are large enough to avoid any color moiré because there are thirty-two combinations of different components. A common alternative approach is to set two of the three-color difference vectors null while setting the remaining difference vectors large.1 This design practice for three-color moiré-free halftone printing can be specified by the following vector equations: Equations (3a) and (3b) represent two of all possible frequency combinations of the three colors. In most practical applications, the remaining combinations satisfy the inequality of Eq. (2). It is instructive to view the frequency vectors of the conventional moiré-free configuration. Figure 2(a) shows the fundamental frequency vectors of the individual screens, and Fig. 2(b) shows the vector combinations of Eq. (3). 2.3.Nonorthogonal Clustered-Dot ScreensMost halftone screens used in color reproduction are orthogonal screens. That is, the screens are constructed of rectangular cells, or more likely, square cells. However, for most digital printing devices, the size and shape of halftone cells are constrained by a digital rectilinear pixel grid, which defines the locations of printed spots, and therefore, an exact 15 or 75 deg rotation of a clustered-dot screen is not possible. Although there are alternative approaches for moiré-free color halftoning, most of those methods provide approximate solutions and/or have a tendency to generate additional artifacts in the halftone outputs. The difficulty to achieve moiré-free color halftoning is greatly relieved by using non-orthogonal halftone cells, which tile a screen with general parallelogram shapes. Wang et al.12 provide detailed description of the design procedure for moiré-free halftoning using nonorthogonal clustered dot screens. An example of a moiré-free nonorthogonal screen is illustrated in Figs. 3 and 4. The three parallelograms in Fig. 3 illustrate the shape and orientation of the halftone cells that define the screens. The corresponding frequency vectors are shown in Fig. 4(a). A halftone image resulting from this configuration is shown in Fig. 4(b). Fig. 4(a) Fundamental frequency vectors for the nonorthogonal screens of Fig. 3; (b) halftone rosettes formed from that set of moiré-free nonorthogonal halftone screens.  2.4.Pellar Spot FunctionA halftone cell that is replicated to tile an image plane can be specified by an array of threshold values, along with three parameters: width and height of the array, and an offset of successive rows in tiling the array.13 The threshold values are often selected using what is known as a spot function. The Pellar14,15 spot function, also known as the Euclidean profile,2 is parameterized as a sum of two cosine functions and has several desirable features: where is the threshold function that is compared to the input image pixel values in the halftoning operation. In practice, would be scaled and offset to have the same range as the image data, e.g., [0, 255]. The thresholding result by the Pellar spot function is a black compact disk for lower input levels, a diamond at middle input levels where the dots touch, and a compact white hole for higher input levels [contours shown in Fig. 5(a)].As shown in Fig. 5(b), in instances where the clustered-dot screen is an orthogonal halftone screen, all clusters, or dots, are centered on the intersection points of a grid, or lattice. The lattice is defined by two sets of parallel lines and , such that the lines are perpendicular to the lines . The periods of the lattice in two different directions, 45 and directions are defined by the shortest distance between the adjacent parallel lines of the first group, denoted by and the shortest distance between the adjacent parallel lines of the second group, denoted by . The threshold value at an arbitrary point , defined by the distances, and , from the point to the adjacent orthogonal grid lines and , respectively, is given by the function in Eq. (4). Since the two cosine functions in of Eq. (4) are defined with periods and , respectively, it does not matter which particular grid lines within each of the twosets are chosen to define the distance or . 3.Hexagonal Halftone GeometryThe novel halftone configuration that we present utilizes three or four rotated hexagonal screens, or more precisely, screens with hexagonally tiled clusters, for moiré-free color printing. Halftone designers consider many options to deliver halftone screens with desirable characteristics, and often must settle for less than desirable results. The present method is a new option with several potential beneficial properties compared to conventional square-cell-based screens. Hexagonal screens can appear to have smoother texture. Due to differences in tiling geometry and touch point geometry, hexagons have the potential to possess different tone reproduction characteristics, which may be favorable for some marking processes. A clustered-dot fourth screen (e.g., ) can be included moiré-free, thereby avoiding problems associated with suboptimal solutions for . The configuration has the following properties. Each screen is constructed of tessellated convex hexagons, where a screen can be thought of as having three fundamental frequencies that are similar in vector length. One pair of screens possesses frequency vectors that are approximately equal in length and are within one frequency range. A second pair of screens also possesses frequency vectors of approximately equal length and can be constructed from sums and differences of frequency vectors from the first pair. The frequency vectors of the present halftone configuration can be readily achieved with common orthogonal pixel grids, as opposed to methods that relied on a hexagonal pixel grid.6 3.1.Hexagonally-Tiled-Cluster Halftone and its Frequency RepresentationAlthough the appearance of hexagonally tiled hexagon clusters is quite different from square or rectangular tiled clusters, spatially repeated hexagons are essentially the result of tiling, or two-dimensional replication using a parallelogram, shown in the example of Fig. 6(a) by blue outlines. Hence, the hexagonal halftone shown in Fig. 6(a) is a two-dimensional periodic structure and can be represented by two fundamental frequency vectors, and , shown in Figs. 6(a) and 6(b), defined for the corresponding nonorthogonal parallelogram screen. As discussed in the previous sections, a two-dimensionally repeated halftone pattern possesses many frequency harmonics as linear combination of the two fundamentals. For a hexagonal halftone pattern, one of the harmonics is noteworthy because its frequency vector length is exactly the same as the length of the two fundamentals if the hexagons are regular (i.e., 0 to 60 to 120 deg). The hexagons in Fig. 6(a) are regular and the noteworthy vector is shown as in Fig. 6(b). Fig. 6(a) Halftone pattern hexagonally tiled with hexagon-shape clusters; (b) frequency vector representation of the regular hexagonal halftone pattern of (a).  Any two of the three vectors, , and , can be used as fundamental frequency vectors and the third is equal to the sum of the two fundamentals (or their conjugates). Thus, we may loosely refer to the set of three as the “fundamentals” of a hexagonal halftone screen. In the following discussion, we use quotation marks for the three “fundamentals” to avoid confusion with the original meaning of fundamental frequencies for two-dimensional periodic functions in Fourier analysis. We may have arrived at the reason that hexagons have found little use in -color halftoning. While designers currently struggle under the constraint of using square-based cells that require sums of Npairs of frequency vectors to avoid moiré, hexagonal halftones require Ntriplets of frequency vectors to avoid moiré. 3.2.Moiré-Free Condition for Regular Hexagonal ScreensThe interference of the various color separations when using multiple hexagonal halftone screens is much more complicated than the interference due to square-cell screens. Because of the presence of three “fundamentals” in a hexagonal halftone screen, the moiré-free conditions, Eqs. (1) through (3), have to be extended to all combinations of frequency vectors chosen from a redefined set of “fundamentals.” For each hexagon screen in the configuration, the third “fundamental” is defined as where and are the two fundamental frequency vectors defined previously for general non-orthogonal screens.In the conventional three-color moiré-free halftoning cases, three rotated screens with square cells are separated by 30 deg between the halftone color separations. The same approach does not work for the hexagonal case because rotating a regular hexagon by 60 deg results in an identical tiling yielding screens that are not mutually rotated and therefore sensitive to color-to-color misregistration. Another initial thought is to rotate the three (C, M, and K) hexagonal screens by of the symmetry to evenly divide the angle space, similar to rotating the three square-cell screens by of their symmetry (). Examination of Eq. (3) shows that angular separation by 20 deg does not produce a moiré-free result. Evidently, it is not straightforward to satisfy moiré-free conditions using rotated regular hexagonal screens. This obstacle may help explain why hexagonal screens seldom appear in practical applications of color halftoning. 3.3.Moiré-Free Solution Using Four Regular Rotated Hexagonal ScreensThe general principle that defines the configuration is the following. Each screen is constructed of regular hexagons, where a screen can be thought of as having three “fundamental” frequencies of equal vector length separated by 60 deg. In a first pair of screens (A and B), the frequency vectors of screen A are of equal length to the vectors of screen B, and the frequency vectors of screen A are separated by 30 deg from the vectors of screen B. A second pair of screens (C and D) also have equal length frequency vectors and are separated by 30 deg, but their frequency length is greater than those of the first pair of screens and the frequency vectors are rotated 15 deg from the first pair of screens. While we describe four screens in the above configuration, any three of that configuration is a useful configuration (e.g., for CMK three colors). Let us examine a specific case of interest. We propose a configuration using three or four halftone screens with regular-hexagon-symmetry for moiré-free color halftoning. The proposed configuration is shown by the frequency vectors in Fig. 7. We denote the “fundamentals” of the four screens as , , , , , , , , , , , and . For idealized regular hexagons, , , and . In Fig. 7, the angle between a pair of screens of the same frequency is given by pair-to-pair separation is15 deg, i.e., and the frequency vector lengths are related by The images of Fig. 8 compare color halftoning using a classical screen (Fig. 1) to the proposed configuration.3.4.General Solution for Moiré-Free Halftoning Using Four Rotated Tessellated Convex Hexagon ScreensIn this section, we provide a general solution for moiré-free halftoning using four rotated screens with tessellating convex hexagon cells. The term “tessellating convex hexagon” implies that the shape of each cell is such that it can tessellate to fully tile the image plane and it is a convex hexagon. This implies that the two fundamental frequency vectors, and , do not necessarily have the relation as in the regular hexagon cases, i.e., and . For two fundamental frequency vectors of the and screens, , , , and , defined by the notation illustrated in Fig. 9, the third “fundamental” of and are given by The general moiré-free solution can be described by And the third “fundamental” of and is given byFig. 9Moiré-free color halftone frequency vector configuration using general convex tessellating hexagons.  For example, consider two convex tessellating hexagons defined for the and color separations by where notion in units of cycles/inch is used. The solution described by Eqs. (7)(8a)–(9) can be used to find the other two screens as The corresponding third “fundamentals” of the four screens areThe use of the combination of above four screens provides a moiré-free halftoning solution. Halftone outputs comparing examples of regular hexagon tiling to general convex hexagon tiling are shown in Fig. 10. It is particularly interesting to notice that all four halftone screens illustrated here can be implemented digitally using single-cell nonorthogonal halftone screens specified by two spatial vectors16 listed below (in pixel units), respectively, for color printers with a resolution: 4.Hexagonal Spot FunctionHalftone spot function design is generally a monochrome consideration and is optimized for a given marking process or for particular image subject matter.2 There are two primary considerations if we restrict the concerns to image quality on general image subject matter printed using laser printing or lithographic offset: maintain compactness as much as possible through the gray range to minimize noise and instability; control the shape of dot-to-dot touch points to avoid sudden shifts in tone that can occur when dots for the same colorant bridge together. A first thought may be to tile the hexagons side-to-side, but an issue arises in the midtones where narrow white tracks are formed between the dots that could be unstable leading to jumps in a tone reproduction curve, and noise and density variations over time. Rather than use a “topologically strong” side connection between dots, we use a “topologically weak” corner connection. The spot function is parameterized as the weighted sum of three cosines that are functions of distance from three respective reference lines defined by the sides of the hexagon. Algebraic powers of the distances control the shape of the sides of the dot and the sharpness of each spot touch point with its neighboring dots. Weights of the cosines control a sequencing of touches, such that contact with the neighboring dots can occur at three different gray levels, thereby avoiding a large instability and tone jump that can occur for simultaneous touching. Dot rotation can also be performed by rotating the coordinate system (Fig. 11). Fig. 11(a) Intuitive approach to grow dots produces potentially unstable narrow white tracks; (b) corner-touching growth avoids the narrow white tracks but forms two triangular holes in the shadows.  An arbitrary nonorthogonal halftone screen can be defined by two spatial vectors, and , as shown in Fig. 12. The vectors and define a parallelogram that can completely tile the plane of the image being halftoned. The dot shape function can be evaluated within such a parallelogram tile to form a cell. Parallelogram cells can be converted to other geometric forms, such as rectangles, or Holladay bricks.13 In Fig. 12, all clusters are centered on the intersection points of a grid defined by two sets of parallel lines and . The dot shape function for non-orthogonal clusters can be described by the same threshold function used for orthogonal halftone screens in Eq. (4), where the periods of the grid, and , are defined in the two directions, perpendicular to the nonorthogonal grid lines. Similar to the orthogonal case, choosing different grid lines within a parallel set of lines as the distance reference does not change the values of the dot shape function. Fig. 12Nonorthogonal halftone screen with all clusters centered on the intersection points of a grid defined by two spatial vectors, and . 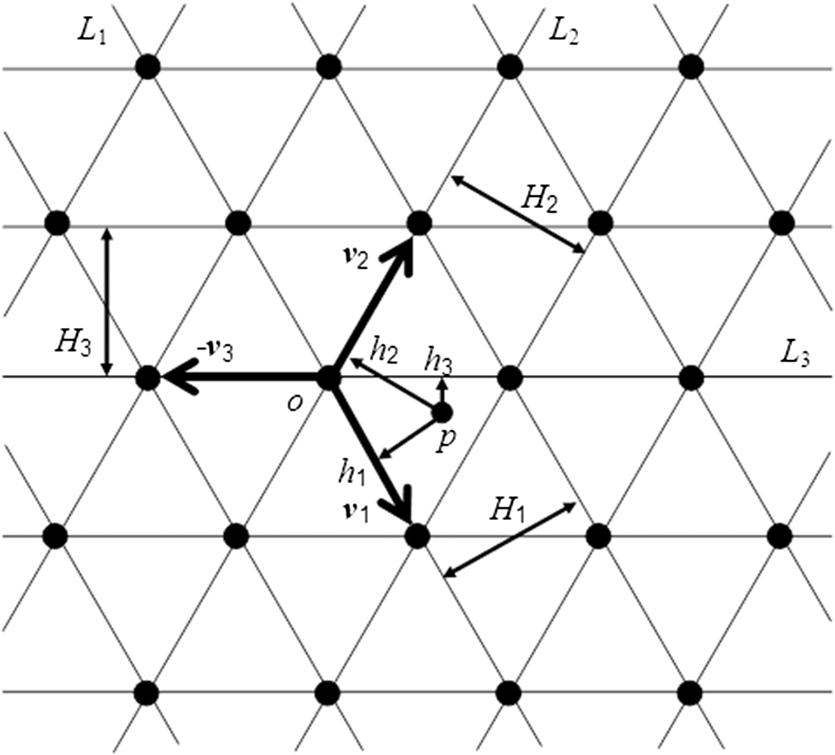 Additional vectors can be used in defining the halftone screen grid. A vector of interest, , is the one that connects an intersection point with a second closest neighboring grid point. The spatial vector is the summation of and : For a square-shape orthogonal screen, this vector is longer than and by , and is angled 45 deg from those vectors. As the angles of the grid depart from orthogonal, the length of becomes closer to and . As shown in the hexagonal halftone screen of Fig. 12, as the angle between and approaches 120 deg, for the length of approaches the length of and the halftone screen grid approaches a regular hexagonal lattice. Each intersection point in the hexagonal halftone screen grid has sixnearest neighboring intersection points that are substantially equidistant, and separated from each other in a hexant arrangement. A third set of parallel lines crossing all intersecting points and parallel to the direction of can be added to the grid, as shown in Fig. 12. The period of the third set of parallel lines is defined as . By vector analysis the three periods, , , and , can be described as functions of the three spatial vectors, , , and : where represents the cross product of vectors and , and is the magnitude of vector . By the definition of vector , or Eq. (10), it can be shown that the magnitudes of all vector products shown in Eqs. (11a) to (11c) are equal and the value of these magnitudes represents the area of the parallelograms defined by any two of the three vectors , , and :For the following derivation, we select an intersection point as a reference point and define the three vectors , , and as sharing the same origin. Then, the distances from an arbitrary point to the three lines , , and defined by the spatial vectors , , and can be described by the following equations, where the spatial vector is defined as from the reference point to the arbitrary point : Using Eq. (12), we can rewrite Eqs. (13a) to (13c) as: where , , and are heights normalized by the grid periods , , and , respectively and have nonnegative values. We use a new dot shape function for hexagonal shaped clustered-dot screens: orSince the vector is defined as the sum of two vectors and , the distance in Eq. (15a) and the corresponding normalized height in Eq. (15b) are not independent. The vector product in Eq. (14c) can be expressed as: In Eq. (16) the three vector products are in the same direction but may carry different signs, plus or minus. Depending on the way of defining the spatial vectors, the normalized height given by Eq. (14c) may be equal to either the sum or the difference of and . To avoid the ambiguity, we define the two spatial vectors and , such that both vectors start from the reference point and the angle from to is positive and the angle is substantially equal to 120 deg. The vector is defined by Eq. (10) and all distances used for the nonorthogonal hexagonal clustered-dot screen are defined by vector product and Eqs. (13a) to (13c). With these above specified definitions, the following relationship exists between the three normalized heights has been found: This allows us to eliminate from Eq. (15b) so that the hexagonal dot shape function can be givenas a function of two independent variables and : By modifying Eq. (15a), a parametrically controlled hexagonal halftone dot shape function can be defined as: where the parameter is a weight that controls the rate at which the th vertex of the dot approaches the vertex of a neighboring dot. When the are substantially equal, the growth of the dot is substantial equal in all threevector directions (positive and negative directions for each of the three vectors). When an value is larger than the other values, the dot becomes eccentric, growing at a faster rate in the direction (positive and negative directions) of the vector associated with the larger . In this respect, this parameter can be used to control which vertices touch at particular gray levels. For example, the parameter in Eq. (19), (, , ) allows neighbor touching at one, two, or three different respective gray levels, thereby avoiding tone instability caused by touching all neighbors simultaneously (i.e., at the same gray level).Furthermore, it can be desirable to control the contour (shape) of a dot perimeter and the touch points to compensate for attributes of the marking engine used to print the halftoned image. The parametrically controlled dot shape function shown in Eq. (20) utilizes an additional set of parameters to control the roundness and convexity/concavity of the dot sides and the sharpness of the vertex touch points: wherein controls the shape of the sides of the dot. In the dot shape function of Eq. (20), the perpendicular distance from the point of interest to the closest grid lines is used to determine each respective .Using a dot shape function in which results in printed hexagonal dots having pincushion (i.e., concave) shaped sides, producing sharper touch points with adjacent dots, which can improve stability of gray tone for marking processes with significant growth. Using a dot shape function having a results in a rounder, convex shape, to the printed dot, which can delay the touching of adjacent dots to darker gray levels. Figure 13 illustrates the effect of . Figure 14 illustrates how the dot shape function can be used to control neighbor halftone dot touching as a function of halftoned image gray level by controlling the parameters. Referring to Fig. 13(c), an example halftone screen output generated by the base hexagonal dot shapefunction of Eq. (15), which is equivalent to the parametrically controlled dot shape function of Eq. (20) with and , is shown producing a halftoned image having a continuously varying gray level progressing from a minimum (e.g., 0 representing the lightest gray level) at the left, to a maximum (e.g., 255, or other scaled number, representing the darkest gray level) at the right. The base hexagonal dot shape function of Eq. (15) begins as substantially circular dots at lighter gray levels, growing to some selected form of hexagon, producing for example regular hexagonal dots in Fig. 13(c), at mid-gray levels, and closes producing compact triangular holesbetween adjacent dots in the darker gray levels. Note that for each dot, the hole is split into two triangles. This split does create thepotential for less stable shadow tones. We note that any halftone dot shape function, such as those represented by the dot function of Eqs. (19) and (20), can be inverted in valueto provide an opposite growth sequence, which could be desirable in some marking processes or image subject matter. Also, the hexagonal dot shape function can be rotated within a fixed position of the hexagonal grid using a coordinate transformation. 5.Hexagonal Dot-Off-Dot ConfigurationDOD screens are sometimes used for uniform tints because they produce much finer textures than conventional rotated dot screens. Rotated dot screens have the negative drawback of possessing a texture frequency component (the rosette) that is roughly half of the halftone frequency.1 Conversely, periodic DOD screens have the desirable attribute of possessing an apparent frequency that is significantly higher than the single-separation halftone frequency. Another positive attribute of DOD screens is that they have the potential to produce colors that are out of the gamut of rotated screens.17 A significant drawback of DOD halftones is that colorant-to-colorant registration must be held to a very tight tolerance (5 to 20 microns for common halftone frequencies) to avoid color shifts, whereas rotated screens are relatively insensitive to colorant-to-colorant misregistration.18 If a print engine can hold tight colorant-to-colorant registration, and hence is able to use DOD screens for tints, the screens would generate acceptable textures using very low frequency halftones, which could drastically reduce noise levels and instability. In addition to the registration sensitivity, another barrier to employing DOD screens occurs when using three colorants. Although methods exist for using two9 or four (Flamenco screens)8 colorants, methods for DOD periodic clustered dot halftoning three colorants have not been previously taught. Harrington10 taught a method that can perform DOD with an arbitrary number of colors, but the dot growth is along a growth curve rather than according to a conventional spot function. Here, we present a three-colorant dot-off-dot (DOD) halftone configuration using hexagonal geometry. The geometry is based on a hexagonal base screen, where the three colorants are printed with specific displacements of the screen. Figure 15 shows a schematic example of a three-colorant halftone using cyan, magenta and black dots, and Fig. 16 illustrates their displacements. As described above, a hexagonal screen has three “fundamental frequencies” (and three corresponding “fundamental periods”), where any one of the fundamentals can be considered dependent on the other two. We can assume that the base screen is used in a reference position for one colorant and the other two colorants use the base screen displaced from the reference position. The displacements are in two different directions, each along the direction of a fundamental frequency. The amount of displacement is 2/3 of the period of the fundamental frequency in the direction of the frequency. Fig. 15Schematic example of a three-colorant DOD hexagonal halftone. The hexagons would not be in the actual image. They are included in the schematic only to better communicate the pattern. The choice of the colorants is arbitrary.  5.1.Comments on TextureWe will compare Fig. 1 to Figs. 17Fig. 18–19 to better understand the nature of the texture difference between a multicolor rotated dot screen and the present three-colorant DOD screen. Figure 17 shows the fundamental periods of a single-colorant hexagonal screen, which corresponds to the spectrum shown in Fig. 6(b). Figure 18 shows the fundamental periods for the three-colorant screen. Note that the frequencies of the texture are higher than in the mono case. Figure 19 shows the frequency vector diagram for the three-colorant hexagonal DOD screen. In comparing Fig. 19 to the frequency diagram in Fig. 1, we see that combining rotated screens produces lower (unwanted) frequency components than what exists in the single-colorant spectrum. These components are considered beats or forms of moiré due to the interaction of the colorants, such as overlap in their optical absorption spectra. Printing DOD using the method described here produces higher frequencies than the single-colorant screen. The overlap in absorption spectra actually suppresses the fundamental frequencies and the combined screens appear to have a higher “combined fundamental frequency.” This phenomenon can be understood by examining a limiting case of optical spectra overlap, where we substitute black halftones for the cyan and magenta halftones in Fig. 18. The additional dots eliminate the single-screen fundamental frequency, and result in a higher “combined fundamental frequency.” Since cyan and magenta absorption spectra do not completely overlap, the single-screen fundamental frequency is not completely suppressed, but its appearance is significantly reduced as is shown in the example below. This suppression of single-screen fundamental frequency allows us to use very low frequency single-colorant screens, which tend to have low noise and high tone stability, while achieving a high frequency appearance for three-color tints. 5.2.ExampleThe example below compares a three-colorant DOD screen with a combined fundamental frequency of roughly 170 cpi to a rotated screen set with fundamental frequencies of roughly 170 cpi. 5.2.1.Parameters for the DOD screen (at )Base screen: , 60.3 deg; , ; , 0 deg. Spatial vectors (in pixel units): and Shift for each screen: ; ; 5.2.2.Parameters for rotated screens (at )Black screen: , 45 deg; , . Cyan screen: , 75 deg; , . Magenta screen: , 15 deg; , . Figure 20 shows a comparison of appearance for the two halftoning methods. Figure 20(a) shows a fine texture, while significant portions of the marking process (exposure, development) operated at only 115 cpi, thereby producing a relatively low-noise print. On the other hand, the rotated screens show less desirable low-feature texture while operating at a noisier, less stable 170 cpi. 6.Areas for Future Study and Summary6.1.Future StudyWhile the present study focuses on enabling the use of hexagonal halftone through particular geometric rules and suitable spot functions, we recognize that additional work in needed in the realm of characterization. In particular, study is needed on the tone reproduction behavior and on the smoothness appearance. At least three points arise when considering the tone reproduction: (1) packing density differences, (2) sixtouch points vs. four, (3) splitting each hole into two triangles. Concerning smoothness, visual comparisons tend to indicate that hexagonally tiled screens have a smoother appearance than conventional square tiled screensfor monochrome images (see Fig. 21). This may be due to the more complex frequency spectrum providing some level of masking of the periodic structure. A visual model or empirical study will be needed to better understand this potential smoothness effect. A visual comparison of smoothness for a full color image is not immediately compelling. Consider the example of Fig. 22. The right picture was halftoned by a digital simulation of the conventional square-cell-based halftone screens, and the left one was halftoned by a set of hexagonal screens with the following spatial frequencies (in units of cycles/inch): The frequencies are very low to make the texture apparent in this publication. Empirical print studies are needed to effectively rate the smoothness of these images. The result may be marking process dependent. Another consideration is that many color prints have substantial regions that are primarily monochrome. The hexagonal screen method presented here will allow full color moiré-free printing, with a certain gain in smoothness benefit in the image regions that are predominantly monochrome.6.2.SummaryHexagonal halftone geometries for color printing may have been avoided due to the requirement to include additional frequency vectors into the system while remaining moiré free. We have worked through this issue and presented a halftone configuration that utilizes three or four halftone screens with hexagonally tiled cells and clusters for moiré-free color printing. The configuration has the following properties. Each screen is constructed of tessellated convex hexagons, where a screen can be thought of as having three fundamental frequencies that are similar in vector length. One pair of screens possesses frequency vectors that are approximately equal in length and are within one frequency range. A second pair of screens also possesses frequency vectors of approximately equal length and can be constructed from sums and differences of frequency vectors from the first pair. The frequency vectors of this configuration can be readily achieved with common orthogonal pixel grids. This halftone configuration presents a new option with several potential beneficial properties compared to conventional square-cell-based screens. Hexagonal screens can appear to have smoother texture, at least in image regions that are predominantly monochrome. Due to differences in packing geometry and touch point geometry, hexagons have the potential to possess different tone reproduction characteristics, which may be favorable for some marking processes. A fourth screen (e.g., yellow) can be included moiré-free, thereby avoiding problems associated with stochastic or low contrast moiré solutions for yellow. Also presented was a corresponding parametrically controlled hexagonal halftone spot function that allows for optimization of dot touch points and provides compact growth. The optimized touch points can prevent a tone reproduction discontinuity, while the compact growth throughout the gray range ensures maximum stability. Examples are provided. Additionally, we presented a hexagonal-dot-off-dot configuration for three colorants, where previously taught methods for clustered periodic screens allowed for two or four8,9 colors. These DOD configurations produce very smooth tints at the cost of maintaining very tight color-to-color registration, which may need to be on the order of 5 to 20 microns18 for common screen frequencies. ReferencesJ. A. C. Yule, Principles of Color Reproduction, John Wiley & Sons, New York
(1967). Google Scholar
P. Fink, Post Script Screening: Adobe Accurate Screens, Adobe Press(1992). Google Scholar
I. AmidrorR. D. HerschV. Ostromoukhov,
“Spectral analysis and minimization of moiré patterns in color separation,”
J. Electron. Imag., 3
(3), 295
–317
(1994). http://dx.doi.org/10.1117/12.179355 JEIME5 1017-9909 Google Scholar
R. C. StauntonN. Storey,
“A comparison between square and hexagonal sampling methods for pipeline image processing,”
1194 142
–151
(1990). PSISDG 0277-786X Google Scholar
R. Ulichney, Digital Halftoning, 117
–126 The MIT Press, Cambridge, MA
(1987). Google Scholar
M. Turbeket al.,
“Comparison of hexagonal and square dot centers for EP halftones,”
in Proc. of IS&T PICS: Image Processing, Image Quality, Image Capture Systems Conf.,
321
–325
(2000). Google Scholar
C. Eliezer,
“Color screening technology: a tutorial on the basic issues,”
The Seybold Report on Desktop Publishing, 6
(2), 3
–25
(1991). Google Scholar
I. Amidror, The Theory of the Moiré Phenomenon: Volume I: Periodic Layers, Springer-Verlag, New York City
(2009). Google Scholar
S. WangZ. FanZ. Wen,
“Non-orthogonal halftone screens,”
in Proc. NIP18: International Conf. on Digital Printing Technologies,
578
–584
(2002). Google Scholar
T. M. Holladay,
“An optimal algorithm for halftone generation for displays and hard copies,”
Proc. Soc. Inf. Display, 21
(2), 185
–192
(1980). SIDPAA 0036-1496 Google Scholar
C. HainsS. G. WangK. Knox,
“Digital color halftones,”
Digital Color Imaging Handbook, 385
–490 CRC Press, New York
(2003). Google Scholar
W. RhodesC. Hains,
“The influence of halftone orientation on color gamut and registration sensitivity,”
in Proc. IS&T’s 46th Annual Conf.,
180
–182
(1993). Google Scholar
B. OztanG. SharmaR. Loce,
“Misregistration sensitivity in clustered dot halftones,”
J. Electron. Imag., 17
(2), 023004
(2008). http://dx.doi.org/10.1117/1.2917517 JEIME5 1017-9909 Google Scholar
Biography Shen-Ge Wang received his BS in instrumental mechanics from Changchun Institute of Optics in China and his PhD in optics from the University of Rochester. Currently, he is a principal scientist working at the Xerox Research Center Webster in Webster, NY. His recent work has focused on digital halftoning, printer modeling, and digital watermark technologies.  Robert Loce is a principal scientist and technical manager in the Xerox Research Center Webster. He joined Xerox in 1981 with an associate degree in optical engineering technology from MonroeCommunity College. While working in optical and imaging technology and research departments at Xerox, he received a BS in photographic science (RIT 1985), an MS in optical engineering (UR 1987), and a PhD in imaging science (RIT 1993). A significant portion of his earlier career was devoted to development of image processing methods for color electronic printing. His current research activities involve leading an organization and projects into new video technologies that are relevant to transportation and healthcare. He has publications and many patents in the areas of digital image processing, image enhancement, imaging systems, optics, and halftoning. He is a fellow of SPIE and a senior member of IEEE. His publications include a book on enhancement and restoration of digital documents, and book chapters on digital halftoning and digital document processing. He is currently an associate editor for Journal of Electronic Imaging, and has been an associate editor for Real-Time Imaging and IEEE Transactions on Image Processing. |